
How Often Do Crypto and Investment Platforms Issue Updates?
Understanding the update frequency of crypto and investment platforms is essential for investors, traders, and users who rely on these digital tools daily. These updates are not just routine maintenance; they often reflect the platform's commitment to security, usability, and staying competitive in a rapidly evolving industry. This article explores how often these platforms typically issue updates, what drives these changes, and the potential implications for users.
The Typical Update Cycle in Crypto Exchanges
Major cryptocurrency exchanges like Binance, Coinbase, and Kraken tend to update their platforms multiple times annually. These updates can be categorized into minor bug fixes or significant feature releases. For example:
- Security patches are released regularly to address vulnerabilities that could compromise user funds or data.
- Performance improvements help ensure smooth trading experiences during high-volume periods.
- New features, such as advanced charting tools or additional trading pairs, are introduced periodically to attract new users and retain existing ones.
The frequency of updates depends largely on market demands and technological advancements but generally ranges from quarterly to monthly releases for critical security patches.
Wallets: Frequent Updates Focused on Security & Usability
Cryptocurrency wallets like MetaMask or Ledger Live undergo frequent updates—sometimes weekly—to enhance security measures or improve user interfaces. Wallet providers prioritize:
- Adding support for new tokens
- Improving transaction speed
- Strengthening encryption protocols
- Fixing bugs that may affect transaction accuracy
Given the sensitive nature of wallets—holding private keys—their update cycle emphasizes security enhancements more than cosmetic changes.
Trading Platforms: Balancing Innovation with Stability
Trading platforms such as eToro or Robinhood also release regular updates aimed at expanding functionalities while maintaining stability. These include:
- Introducing new trading instruments (e.g., options or derivatives)
- Enhancing mobile app performance
- Addressing technical issues reported by users
- Updating compliance features in response to regulatory changes
Because trading activity directly impacts financial outcomes, developers tend to schedule updates carefully—often during off-hours—to minimize disruptions.
Recent Developments Reflect Industry Trends
Recent platform upgrades highlight ongoing trends within the industry:
Real-Time Data Integration
Platforms like EigenLayer USD have incorporated real-time quotes, historical data analysis tools, and interactive charts—features crucial for informed decision-making by investors[1].
Stable Exchange Rates
For example, fluctuations in currency pairs such as USD/TND remain minimal (around 0.03%), reflecting efforts toward stability which benefit traders relying on predictable exchange rates[5].
Performance Enhancements
Projects like Dogwifhat USD focus on improving market visibility through real-time quotes and historical performance charts[4], demonstrating how continuous improvement supports investor confidence.
Risks Associated with Frequent Platform Updates
While regular updates aim at enhancing functionality and security—they can sometimes introduce unintended risks:
Security Vulnerabilities
A poorly tested update might open doors for cyberattacks; recent incidents have shown that bugs introduced during an update can lead to unauthorized account access resulting in financial losses[1].
Temporary Disruptions
Major upgrades occasionally cause downtime—a frustrating experience especially during volatile markets when quick trades are essential[1]. Such disruptions underscore the importance of transparent communication from platform providers about scheduled maintenance windows.
Market Volatility Impact
New features introduced via platform upgrades can influence market behavior—for instance, adding novel trading instruments may attract more traders but also increase volatility if not managed properly[1].
Why Staying Informed About Update Schedules Matters
For investors using crypto exchanges or wallets daily—or even those holding long-term positions—it’s vital to stay aware of upcoming platform changes. Regularly checking official channels ensures you’re prepared for potential downtimes or security alerts that could impact your assets’ safety.
Moreover, understanding why certain features are updated helps build trust with service providers who prioritize transparency about their development cycles—a key aspect contributing to their credibility (E-A-T).
By recognizing how frequently crypto platforms issue updates—and why—they do so—you gain insight into maintaining a secure investment environment while leveraging innovative features designed to improve your experience. Whether it’s a quarterly patch release or weekly bug fix rollouts, staying informed empowers you as a user navigating this dynamic digital landscape effectively.


JCUSER-F1IIaxXA
2025-05-26 16:55
How often do platforms issue updates?
How Often Do Crypto and Investment Platforms Issue Updates?
Understanding the update frequency of crypto and investment platforms is essential for investors, traders, and users who rely on these digital tools daily. These updates are not just routine maintenance; they often reflect the platform's commitment to security, usability, and staying competitive in a rapidly evolving industry. This article explores how often these platforms typically issue updates, what drives these changes, and the potential implications for users.
The Typical Update Cycle in Crypto Exchanges
Major cryptocurrency exchanges like Binance, Coinbase, and Kraken tend to update their platforms multiple times annually. These updates can be categorized into minor bug fixes or significant feature releases. For example:
- Security patches are released regularly to address vulnerabilities that could compromise user funds or data.
- Performance improvements help ensure smooth trading experiences during high-volume periods.
- New features, such as advanced charting tools or additional trading pairs, are introduced periodically to attract new users and retain existing ones.
The frequency of updates depends largely on market demands and technological advancements but generally ranges from quarterly to monthly releases for critical security patches.
Wallets: Frequent Updates Focused on Security & Usability
Cryptocurrency wallets like MetaMask or Ledger Live undergo frequent updates—sometimes weekly—to enhance security measures or improve user interfaces. Wallet providers prioritize:
- Adding support for new tokens
- Improving transaction speed
- Strengthening encryption protocols
- Fixing bugs that may affect transaction accuracy
Given the sensitive nature of wallets—holding private keys—their update cycle emphasizes security enhancements more than cosmetic changes.
Trading Platforms: Balancing Innovation with Stability
Trading platforms such as eToro or Robinhood also release regular updates aimed at expanding functionalities while maintaining stability. These include:
- Introducing new trading instruments (e.g., options or derivatives)
- Enhancing mobile app performance
- Addressing technical issues reported by users
- Updating compliance features in response to regulatory changes
Because trading activity directly impacts financial outcomes, developers tend to schedule updates carefully—often during off-hours—to minimize disruptions.
Recent Developments Reflect Industry Trends
Recent platform upgrades highlight ongoing trends within the industry:
Real-Time Data Integration
Platforms like EigenLayer USD have incorporated real-time quotes, historical data analysis tools, and interactive charts—features crucial for informed decision-making by investors[1].
Stable Exchange Rates
For example, fluctuations in currency pairs such as USD/TND remain minimal (around 0.03%), reflecting efforts toward stability which benefit traders relying on predictable exchange rates[5].
Performance Enhancements
Projects like Dogwifhat USD focus on improving market visibility through real-time quotes and historical performance charts[4], demonstrating how continuous improvement supports investor confidence.
Risks Associated with Frequent Platform Updates
While regular updates aim at enhancing functionality and security—they can sometimes introduce unintended risks:
Security Vulnerabilities
A poorly tested update might open doors for cyberattacks; recent incidents have shown that bugs introduced during an update can lead to unauthorized account access resulting in financial losses[1].
Temporary Disruptions
Major upgrades occasionally cause downtime—a frustrating experience especially during volatile markets when quick trades are essential[1]. Such disruptions underscore the importance of transparent communication from platform providers about scheduled maintenance windows.
Market Volatility Impact
New features introduced via platform upgrades can influence market behavior—for instance, adding novel trading instruments may attract more traders but also increase volatility if not managed properly[1].
Why Staying Informed About Update Schedules Matters
For investors using crypto exchanges or wallets daily—or even those holding long-term positions—it’s vital to stay aware of upcoming platform changes. Regularly checking official channels ensures you’re prepared for potential downtimes or security alerts that could impact your assets’ safety.
Moreover, understanding why certain features are updated helps build trust with service providers who prioritize transparency about their development cycles—a key aspect contributing to their credibility (E-A-T).
By recognizing how frequently crypto platforms issue updates—and why—they do so—you gain insight into maintaining a secure investment environment while leveraging innovative features designed to improve your experience. Whether it’s a quarterly patch release or weekly bug fix rollouts, staying informed empowers you as a user navigating this dynamic digital landscape effectively.
Disclaimer:Contains third-party content. Not financial advice.
See Terms and Conditions.
What Is a Common Gap in Crypto and Investment Markets?
Understanding the landscape of cryptocurrency and investment markets reveals several recurring challenges, but one of the most prevalent issues is the regulatory gap. This gap refers to the lack of clear, consistent regulations governing crypto activities across different jurisdictions. As digital assets continue to grow in popularity and market capitalization, governments and regulatory bodies worldwide are struggling to establish comprehensive frameworks that protect investors while fostering innovation.
The regulatory gap creates significant uncertainty for market participants. Without well-defined rules, companies face legal ambiguities that can hinder product development, limit market entry, or lead to costly legal disputes. Investors may also be hesitant due to fears of sudden regulatory crackdowns or changes that could impact their holdings negatively. For example, in 2023, the U.S. Securities and Exchange Commission (SEC) issued warnings about crypto investments' risks without providing detailed guidelines on compliance or security standards—highlighting this ongoing challenge.
This uncertainty impacts not only individual investors but also institutional players who require clarity before allocating substantial capital into crypto assets. The absence of standardized regulations can result in uneven enforcement across regions, creating a fragmented global market where some jurisdictions are more welcoming than others.
Addressing this common gap involves collaborative efforts among regulators, industry stakeholders, and technology developers to craft balanced policies that promote transparency without stifling innovation. Clearer regulations would help reduce fraud risks, improve investor confidence, and facilitate mainstream adoption by providing a predictable environment for all parties involved.
Why Regulatory Gaps Persist
Several factors contribute to why these gaps remain unfilled:
- Rapid Industry Growth: The fast-paced evolution of blockchain technology outpaces legislative processes.
- Jurisdictional Differences: Countries have varying approaches—some embrace crypto with open policies; others impose strict bans.
- Complexity of Technology: Understanding blockchain's technical aspects makes regulation challenging.
- Balancing Innovation & Security: Regulators aim to foster innovation while protecting consumers from scams or security breaches.
The Impact on Market Stability
Unaddressed regulatory gaps can lead directly to increased volatility within crypto markets. When investors perceive an uncertain legal environment—especially amid high-profile security breaches or scams—they may withdraw funds en masse or avoid participating altogether. This behavior exacerbates price swings and undermines trust in digital assets as reliable investment options.
Furthermore, lack of regulation can enable malicious actors exploiting loopholes for fraudulent schemes like pump-and-dump operations or Ponzi schemes—further damaging industry reputation over time.
Steps Toward Closing the Gap
To bridge this critical divide:
- International Cooperation: Countries need coordinated efforts through organizations such as FATF (Financial Action Task Force) for harmonized standards.
- Transparent Frameworks: Regulators should develop clear guidelines covering key areas like anti-money laundering (AML), know-your-customer (KYC), securities classification, taxation policies.
- Industry Engagement: Stakeholders must participate actively in policy discussions ensuring regulations are practical yet effective.
- Education & Awareness Campaigns: Increasing understanding among users reduces misinformation-driven panic during regulatory shifts.
By focusing on these strategies—and learning from recent developments such as Coinbase’s acquisition efforts aimed at expanding derivatives services—the industry can move toward more stable governance structures that support sustainable growth.
How Addressing Regulatory Gaps Benefits Stakeholders
Closing this common gap benefits everyone involved—from individual traders seeking safer environments for transactions to large institutions looking for predictable operational conditions:
- Enhanced Investor Confidence
- Reduced Fraud & Security Risks
- Increased Market Liquidity
- Greater Adoption Rates
In turn, these improvements foster a healthier ecosystem where technological innovations flourish alongside robust protections against misuse or abuse—a vital step toward mainstream acceptance of cryptocurrencies as legitimate financial instruments.
Semantic Keywords & Related Terms
Throughout discussions about gaps in crypto markets often include terms like "regulatory framework," "compliance standards," "cryptocurrency laws," "market stability," "investor protection," "blockchain regulation," and "crypto legislation." Recognizing these helps clarify how addressing one common issue influences multiple facets within the broader financial ecosystem related to digital currencies.
Summary
A prevalent challenge across cryptocurrency markets is bridging the regulatory gap—a persistent obstacle stemming from inconsistent laws worldwide combined with rapid technological advancements. Tackling this issue requires coordinated international efforts focused on creating transparent rules that balance innovation with security needs while fostering investor confidence and market stability over time.
References
1. SEC Crypto Warnings 2023
2. Crypto Regulation Challenges
3. Industry Efforts Toward Regulation
4. Global Blockchain Adoption
JCUSER-F1IIaxXA
2025-05-20 04:39
What’s a common gap?
What Is a Common Gap in Crypto and Investment Markets?
Understanding the landscape of cryptocurrency and investment markets reveals several recurring challenges, but one of the most prevalent issues is the regulatory gap. This gap refers to the lack of clear, consistent regulations governing crypto activities across different jurisdictions. As digital assets continue to grow in popularity and market capitalization, governments and regulatory bodies worldwide are struggling to establish comprehensive frameworks that protect investors while fostering innovation.
The regulatory gap creates significant uncertainty for market participants. Without well-defined rules, companies face legal ambiguities that can hinder product development, limit market entry, or lead to costly legal disputes. Investors may also be hesitant due to fears of sudden regulatory crackdowns or changes that could impact their holdings negatively. For example, in 2023, the U.S. Securities and Exchange Commission (SEC) issued warnings about crypto investments' risks without providing detailed guidelines on compliance or security standards—highlighting this ongoing challenge.
This uncertainty impacts not only individual investors but also institutional players who require clarity before allocating substantial capital into crypto assets. The absence of standardized regulations can result in uneven enforcement across regions, creating a fragmented global market where some jurisdictions are more welcoming than others.
Addressing this common gap involves collaborative efforts among regulators, industry stakeholders, and technology developers to craft balanced policies that promote transparency without stifling innovation. Clearer regulations would help reduce fraud risks, improve investor confidence, and facilitate mainstream adoption by providing a predictable environment for all parties involved.
Why Regulatory Gaps Persist
Several factors contribute to why these gaps remain unfilled:
- Rapid Industry Growth: The fast-paced evolution of blockchain technology outpaces legislative processes.
- Jurisdictional Differences: Countries have varying approaches—some embrace crypto with open policies; others impose strict bans.
- Complexity of Technology: Understanding blockchain's technical aspects makes regulation challenging.
- Balancing Innovation & Security: Regulators aim to foster innovation while protecting consumers from scams or security breaches.
The Impact on Market Stability
Unaddressed regulatory gaps can lead directly to increased volatility within crypto markets. When investors perceive an uncertain legal environment—especially amid high-profile security breaches or scams—they may withdraw funds en masse or avoid participating altogether. This behavior exacerbates price swings and undermines trust in digital assets as reliable investment options.
Furthermore, lack of regulation can enable malicious actors exploiting loopholes for fraudulent schemes like pump-and-dump operations or Ponzi schemes—further damaging industry reputation over time.
Steps Toward Closing the Gap
To bridge this critical divide:
- International Cooperation: Countries need coordinated efforts through organizations such as FATF (Financial Action Task Force) for harmonized standards.
- Transparent Frameworks: Regulators should develop clear guidelines covering key areas like anti-money laundering (AML), know-your-customer (KYC), securities classification, taxation policies.
- Industry Engagement: Stakeholders must participate actively in policy discussions ensuring regulations are practical yet effective.
- Education & Awareness Campaigns: Increasing understanding among users reduces misinformation-driven panic during regulatory shifts.
By focusing on these strategies—and learning from recent developments such as Coinbase’s acquisition efforts aimed at expanding derivatives services—the industry can move toward more stable governance structures that support sustainable growth.
How Addressing Regulatory Gaps Benefits Stakeholders
Closing this common gap benefits everyone involved—from individual traders seeking safer environments for transactions to large institutions looking for predictable operational conditions:
- Enhanced Investor Confidence
- Reduced Fraud & Security Risks
- Increased Market Liquidity
- Greater Adoption Rates
In turn, these improvements foster a healthier ecosystem where technological innovations flourish alongside robust protections against misuse or abuse—a vital step toward mainstream acceptance of cryptocurrencies as legitimate financial instruments.
Semantic Keywords & Related Terms
Throughout discussions about gaps in crypto markets often include terms like "regulatory framework," "compliance standards," "cryptocurrency laws," "market stability," "investor protection," "blockchain regulation," and "crypto legislation." Recognizing these helps clarify how addressing one common issue influences multiple facets within the broader financial ecosystem related to digital currencies.
Summary
A prevalent challenge across cryptocurrency markets is bridging the regulatory gap—a persistent obstacle stemming from inconsistent laws worldwide combined with rapid technological advancements. Tackling this issue requires coordinated international efforts focused on creating transparent rules that balance innovation with security needs while fostering investor confidence and market stability over time.
References
1. SEC Crypto Warnings 2023
2. Crypto Regulation Challenges
3. Industry Efforts Toward Regulation
4. Global Blockchain Adoption
Disclaimer:Contains third-party content. Not financial advice.
See Terms and Conditions.
What’s the McClellan Oscillator?
The McClellan Oscillator is a widely used technical analysis tool that helps traders and investors assess the overall health of the stock market by measuring market breadth. Developed in the 1960s by Sherman and Marian McClellan, this indicator provides valuable insights into whether market movements are supported by broad participation across stocks or driven by a few large-cap stocks. Understanding how to interpret this oscillator can enhance your ability to identify potential trend reversals and confirm ongoing market trends.
How Does the McClellan Oscillator Work?
At its core, the McClellan Oscillator calculates the difference between two key components: advancing stocks and declining stocks. It uses data from daily stock exchanges to determine how many stocks are moving higher versus those moving lower. This difference is then smoothed using exponential moving averages (EMAs) to produce a line chart that oscillates above and below zero.
When more stocks are advancing than declining, the oscillator shows positive values, indicating bullish sentiment across broader segments of the market. Conversely, negative readings suggest bearish conditions with more declining stocks than advancing ones. Traders often look for divergences—situations where price action moves contrary to what breadth indicators suggest—as signals of potential trend reversals.
Why Is Market Breadth Important?
Market breadth measures how widespread buying or selling activity is within an index or entire market. A rising index accompanied by strong breadth suggests healthy participation from many stocks, reinforcing bullish momentum. On the other hand, if an index advances while only a handful of large-cap stocks lead it higher—indicated by weak breadth—the rally may lack sustainability.
The McClellan Oscillator serves as an effective gauge of this participation level because it distills complex data about individual stock movements into a single, easy-to-interpret line. This makes it particularly useful for identifying when underlying strength supports or contradicts price trends.
Interpreting Signals from the McClellan Oscillator
Traders primarily use two types of signals from this indicator:
Positive/Negative Readings: When values cross above zero into positive territory, it suggests increasing bullishness; crossing below zero indicates bearish sentiment.
Divergences: If prices reach new highs but the oscillator fails to confirm with similar highs (a divergence), it could signal weakening momentum and potential reversal points.
Additionally, extreme overbought or oversold levels—often identified through specific threshold lines—can alert traders to possible upcoming corrections or rallies before they unfold in price charts.
Recent Trends in Using The McClellan Oscillator
In modern trading environments characterized by rapid information flow and algorithmic strategies, tools like the McClellan Oscillator remain relevant due to their simplicity and effectiveness in capturing broad-market shifts quickly. Many traders incorporate it alongside other technical indicators such as moving averages or RSI (Relative Strength Index) for confirmation purposes.
Furthermore, there’s growing interest in adapting these traditional tools beyond equities—for example, applying similar breadth analysis techniques within cryptocurrency markets despite their high volatility levels. While still experimental due to differing asset dynamics compared with traditional markets, these efforts highlight ongoing innovation driven by trader demand for comprehensive analysis methods.
Limitations & Cautions When Using The Indicator
Despite its usefulness, relying solely on any single technical indicator—including the McClellan Oscillator—can be risky:
Short-term signals: The oscillator tends to generate frequent fluctuations that may not always translate into meaningful long-term trend changes.
Market context: Breadth indicators should be interpreted within broader frameworks including fundamental analysis and macroeconomic factors.
False signals: Divergences can sometimes produce false alarms; therefore combining multiple indicators enhances reliability.
It’s essential for traders—and especially those managing significant portfolios—to understand these limitations before making decisions based solely on oscillators like this one.
Practical Tips for Traders
To maximize effectiveness when using the McClellan Oscillator:
- Watch for crossings above/below zero as initial signs of changing momentum.
- Confirm divergence signals with other technical tools such as volume analysis or trendlines.
- Be cautious during highly volatile periods where false signals are more common.
- Use historical thresholds (e.g., +50/-50) cautiously—they’re helpful but not definitive on their own.
Historical Significance & Notable Usage
Throughout history—including during major events like 2008 financial crisis—the McClellan Oscillator has proven valuable in anticipating shifts before they fully materialize in prices thanks to its focus on underlying market participation rather than just price action alone.
Many experienced traders consider it part of their core toolkit because it offers insight into whether current moves have broad support—a crucial factor when assessing sustainability.
How To Incorporate The MacLeallan Into Your Trading Strategy
Integrating this tool effectively involves understanding both its strengths and limitations:
- Use alongside trend-following systems such as moving averages
- Look for confirmation through volume patterns
- Monitor divergence signs carefully
- Combine with fundamental insights about economic conditions
Final Thoughts: Is The MacLeallan Still Relevant Today?
Yes — despite being over half a century old —the MacLeallan remains relevant because of its straightforward approach toward measuring market health via breadth analysis . Its ability to provide early warnings about potential reversals makes it invaluable especially when combined with modern analytical techniques like algorithmic trading platforms which can process vast amounts of data efficiently .
While adaptations might be necessary when applying similar concepts within emerging markets like cryptocurrencies due to different asset behaviors , understanding traditional tools such as this one forms a solid foundation upon which innovative strategies can be built.
Keywords: MacLeallanOscillator , MarketBreadth , TechnicalAnalysis , StockMarketIndicators , MarketReversals , TradingStrategies , CryptocurrencyAnalysis
JCUSER-IC8sJL1q
2025-05-20 03:29
What’s the McClellan Oscillator?
What’s the McClellan Oscillator?
The McClellan Oscillator is a widely used technical analysis tool that helps traders and investors assess the overall health of the stock market by measuring market breadth. Developed in the 1960s by Sherman and Marian McClellan, this indicator provides valuable insights into whether market movements are supported by broad participation across stocks or driven by a few large-cap stocks. Understanding how to interpret this oscillator can enhance your ability to identify potential trend reversals and confirm ongoing market trends.
How Does the McClellan Oscillator Work?
At its core, the McClellan Oscillator calculates the difference between two key components: advancing stocks and declining stocks. It uses data from daily stock exchanges to determine how many stocks are moving higher versus those moving lower. This difference is then smoothed using exponential moving averages (EMAs) to produce a line chart that oscillates above and below zero.
When more stocks are advancing than declining, the oscillator shows positive values, indicating bullish sentiment across broader segments of the market. Conversely, negative readings suggest bearish conditions with more declining stocks than advancing ones. Traders often look for divergences—situations where price action moves contrary to what breadth indicators suggest—as signals of potential trend reversals.
Why Is Market Breadth Important?
Market breadth measures how widespread buying or selling activity is within an index or entire market. A rising index accompanied by strong breadth suggests healthy participation from many stocks, reinforcing bullish momentum. On the other hand, if an index advances while only a handful of large-cap stocks lead it higher—indicated by weak breadth—the rally may lack sustainability.
The McClellan Oscillator serves as an effective gauge of this participation level because it distills complex data about individual stock movements into a single, easy-to-interpret line. This makes it particularly useful for identifying when underlying strength supports or contradicts price trends.
Interpreting Signals from the McClellan Oscillator
Traders primarily use two types of signals from this indicator:
Positive/Negative Readings: When values cross above zero into positive territory, it suggests increasing bullishness; crossing below zero indicates bearish sentiment.
Divergences: If prices reach new highs but the oscillator fails to confirm with similar highs (a divergence), it could signal weakening momentum and potential reversal points.
Additionally, extreme overbought or oversold levels—often identified through specific threshold lines—can alert traders to possible upcoming corrections or rallies before they unfold in price charts.
Recent Trends in Using The McClellan Oscillator
In modern trading environments characterized by rapid information flow and algorithmic strategies, tools like the McClellan Oscillator remain relevant due to their simplicity and effectiveness in capturing broad-market shifts quickly. Many traders incorporate it alongside other technical indicators such as moving averages or RSI (Relative Strength Index) for confirmation purposes.
Furthermore, there’s growing interest in adapting these traditional tools beyond equities—for example, applying similar breadth analysis techniques within cryptocurrency markets despite their high volatility levels. While still experimental due to differing asset dynamics compared with traditional markets, these efforts highlight ongoing innovation driven by trader demand for comprehensive analysis methods.
Limitations & Cautions When Using The Indicator
Despite its usefulness, relying solely on any single technical indicator—including the McClellan Oscillator—can be risky:
Short-term signals: The oscillator tends to generate frequent fluctuations that may not always translate into meaningful long-term trend changes.
Market context: Breadth indicators should be interpreted within broader frameworks including fundamental analysis and macroeconomic factors.
False signals: Divergences can sometimes produce false alarms; therefore combining multiple indicators enhances reliability.
It’s essential for traders—and especially those managing significant portfolios—to understand these limitations before making decisions based solely on oscillators like this one.
Practical Tips for Traders
To maximize effectiveness when using the McClellan Oscillator:
- Watch for crossings above/below zero as initial signs of changing momentum.
- Confirm divergence signals with other technical tools such as volume analysis or trendlines.
- Be cautious during highly volatile periods where false signals are more common.
- Use historical thresholds (e.g., +50/-50) cautiously—they’re helpful but not definitive on their own.
Historical Significance & Notable Usage
Throughout history—including during major events like 2008 financial crisis—the McClellan Oscillator has proven valuable in anticipating shifts before they fully materialize in prices thanks to its focus on underlying market participation rather than just price action alone.
Many experienced traders consider it part of their core toolkit because it offers insight into whether current moves have broad support—a crucial factor when assessing sustainability.
How To Incorporate The MacLeallan Into Your Trading Strategy
Integrating this tool effectively involves understanding both its strengths and limitations:
- Use alongside trend-following systems such as moving averages
- Look for confirmation through volume patterns
- Monitor divergence signs carefully
- Combine with fundamental insights about economic conditions
Final Thoughts: Is The MacLeallan Still Relevant Today?
Yes — despite being over half a century old —the MacLeallan remains relevant because of its straightforward approach toward measuring market health via breadth analysis . Its ability to provide early warnings about potential reversals makes it invaluable especially when combined with modern analytical techniques like algorithmic trading platforms which can process vast amounts of data efficiently .
While adaptations might be necessary when applying similar concepts within emerging markets like cryptocurrencies due to different asset behaviors , understanding traditional tools such as this one forms a solid foundation upon which innovative strategies can be built.
Keywords: MacLeallanOscillator , MarketBreadth , TechnicalAnalysis , StockMarketIndicators , MarketReversals , TradingStrategies , CryptocurrencyAnalysis
Disclaimer:Contains third-party content. Not financial advice.
See Terms and Conditions.
How to Calculate Value at Risk (VaR) for a Trading Strategy
Understanding how to accurately calculate Value at Risk (VaR) is essential for traders and investment managers aiming to quantify potential losses and manage risk effectively. VaR provides a statistical estimate of the maximum expected loss over a specified period with a certain confidence level, making it an indispensable tool in modern financial risk management.
What Is Value at Risk (VaR)?
Value at Risk (VaR) measures the potential loss in value of a portfolio under normal market conditions within a defined time horizon. It answers the critical question: "What is the worst-case loss I might face with X% confidence?" For example, if your portfolio has a daily VaR of $1 million at 95% confidence, there is only a 5% chance that losses will exceed this amount on any given day.
Why Is Calculating VaR Important?
Calculating VaR helps traders set appropriate risk limits, allocate capital efficiently, and comply with regulatory standards. It also enables better decision-making by providing insights into potential downside risks associated with trading strategies or investment portfolios. However, it's important to recognize that while VaR offers valuable information about typical market risks, it does not predict extreme events or tail risks effectively.
Common Methods for Calculating VaR
There are several approaches to estimating VaR, each suited for different types of portfolios and data availability:
Historical Simulation: This method uses historical price data to simulate possible future losses based on past market movements. It assumes that historical patterns will continue into the future.
Variance-Covariance Method: Also known as parametric VaR, this approach assumes returns are normally distributed. It calculates potential losses using mean returns and standard deviations derived from historical data.
Monte Carlo Simulation: This technique generates thousands of random scenarios based on specified statistical distributions for asset returns. It provides flexibility in modeling complex portfolios and non-normal return distributions.
Each method has its strengths and limitations; choosing the right one depends on your portfolio's complexity and data quality.
Step-by-Step Guide to Calculating VaR
Calculating VaR involves several key steps:
Data Collection:Gather relevant historical price or return data for all assets within your trading strategy over an appropriate period—typically ranging from one month to several years depending on your analysis horizon.
Determine Time Horizon & Confidence Level:Decide whether you want daily, weekly, or monthly VaRs—and select an appropriate confidence level such as 95% or 99%. The choice reflects how conservative you want your risk estimates to be.
Choose Calculation Method:Select among historical simulation, variance-covariance approach, or Monte Carlo simulation based on your needs.
Compute Portfolio Returns & Variance-Covariance Matrix:For variance-covariance methods especially—calculate individual asset returns' means and standard deviations along with their correlations.
Estimate Distribution & Quantile Calculation:Using the chosen method’s framework—compute the distribution of possible portfolio losses over your selected time horizon.
Identify Loss Thresholds Based on Confidence Level:Determine the quantile corresponding to your confidence level; this value represents your estimated maximum loss within that probability threshold.
Interpret Results & Adjust Strategy Accordingly
Practical Example: Calculating Daily Historical Simulation VAa
Suppose you manage a diversified stock portfolio:
- Collect daily closing prices over two years
- Calculate daily returns
- Rank these returns from worst to best
- Identify the 5th percentile (for 95% confidence)
This percentile indicates how much you could lose in one day under normal conditions with 95% certainty.
Limitations & Best Practices
While calculating VAa provides valuable insights into typical risks faced by trading strategies — it’s crucial not to rely solely on these estimates due t o their limitations:
- They often underestimate tail risks during extreme market events
- Assumptions like normal distribution may not hold true during crises
- Static models may ignore changing market dynamics
To improve accuracy:
- Incorporate stress testing alongside traditional VAa calculations
- Use advanced metrics like Expected Shortfall (ES) which consider average losses beyond the VaRa threshold
- Regularly update models with fresh data reflecting current market conditions
Incorporating Advanced Techniques
Recent developments have seen traders adopt machine learning algorithms and artificial intelligence tools that enhance traditional methods’ predictive power — especially useful when dealing with volatile markets such as cryptocurrencies where conventional models often fall short.
These techniques can analyze complex patterns in large datasets more effectively than classical approaches alone — leading toward more robust risk assessments tailored specifically for high-frequency trading environments or emerging asset classes.
By understanding these core principles—from selecting suitable calculation methods through interpreting results—you can better integrate VaRis into comprehensive risk management frameworks tailored specifically toward optimizing trading strategies while safeguarding against unforeseen downturns.
Lo
2025-05-14 16:26
How do you calculate Value at Risk (VaR) for a trading strategy?
How to Calculate Value at Risk (VaR) for a Trading Strategy
Understanding how to accurately calculate Value at Risk (VaR) is essential for traders and investment managers aiming to quantify potential losses and manage risk effectively. VaR provides a statistical estimate of the maximum expected loss over a specified period with a certain confidence level, making it an indispensable tool in modern financial risk management.
What Is Value at Risk (VaR)?
Value at Risk (VaR) measures the potential loss in value of a portfolio under normal market conditions within a defined time horizon. It answers the critical question: "What is the worst-case loss I might face with X% confidence?" For example, if your portfolio has a daily VaR of $1 million at 95% confidence, there is only a 5% chance that losses will exceed this amount on any given day.
Why Is Calculating VaR Important?
Calculating VaR helps traders set appropriate risk limits, allocate capital efficiently, and comply with regulatory standards. It also enables better decision-making by providing insights into potential downside risks associated with trading strategies or investment portfolios. However, it's important to recognize that while VaR offers valuable information about typical market risks, it does not predict extreme events or tail risks effectively.
Common Methods for Calculating VaR
There are several approaches to estimating VaR, each suited for different types of portfolios and data availability:
Historical Simulation: This method uses historical price data to simulate possible future losses based on past market movements. It assumes that historical patterns will continue into the future.
Variance-Covariance Method: Also known as parametric VaR, this approach assumes returns are normally distributed. It calculates potential losses using mean returns and standard deviations derived from historical data.
Monte Carlo Simulation: This technique generates thousands of random scenarios based on specified statistical distributions for asset returns. It provides flexibility in modeling complex portfolios and non-normal return distributions.
Each method has its strengths and limitations; choosing the right one depends on your portfolio's complexity and data quality.
Step-by-Step Guide to Calculating VaR
Calculating VaR involves several key steps:
Data Collection:Gather relevant historical price or return data for all assets within your trading strategy over an appropriate period—typically ranging from one month to several years depending on your analysis horizon.
Determine Time Horizon & Confidence Level:Decide whether you want daily, weekly, or monthly VaRs—and select an appropriate confidence level such as 95% or 99%. The choice reflects how conservative you want your risk estimates to be.
Choose Calculation Method:Select among historical simulation, variance-covariance approach, or Monte Carlo simulation based on your needs.
Compute Portfolio Returns & Variance-Covariance Matrix:For variance-covariance methods especially—calculate individual asset returns' means and standard deviations along with their correlations.
Estimate Distribution & Quantile Calculation:Using the chosen method’s framework—compute the distribution of possible portfolio losses over your selected time horizon.
Identify Loss Thresholds Based on Confidence Level:Determine the quantile corresponding to your confidence level; this value represents your estimated maximum loss within that probability threshold.
Interpret Results & Adjust Strategy Accordingly
Practical Example: Calculating Daily Historical Simulation VAa
Suppose you manage a diversified stock portfolio:
- Collect daily closing prices over two years
- Calculate daily returns
- Rank these returns from worst to best
- Identify the 5th percentile (for 95% confidence)
This percentile indicates how much you could lose in one day under normal conditions with 95% certainty.
Limitations & Best Practices
While calculating VAa provides valuable insights into typical risks faced by trading strategies — it’s crucial not to rely solely on these estimates due t o their limitations:
- They often underestimate tail risks during extreme market events
- Assumptions like normal distribution may not hold true during crises
- Static models may ignore changing market dynamics
To improve accuracy:
- Incorporate stress testing alongside traditional VAa calculations
- Use advanced metrics like Expected Shortfall (ES) which consider average losses beyond the VaRa threshold
- Regularly update models with fresh data reflecting current market conditions
Incorporating Advanced Techniques
Recent developments have seen traders adopt machine learning algorithms and artificial intelligence tools that enhance traditional methods’ predictive power — especially useful when dealing with volatile markets such as cryptocurrencies where conventional models often fall short.
These techniques can analyze complex patterns in large datasets more effectively than classical approaches alone — leading toward more robust risk assessments tailored specifically for high-frequency trading environments or emerging asset classes.
By understanding these core principles—from selecting suitable calculation methods through interpreting results—you can better integrate VaRis into comprehensive risk management frameworks tailored specifically toward optimizing trading strategies while safeguarding against unforeseen downturns.
Disclaimer:Contains third-party content. Not financial advice.
See Terms and Conditions.
Quantifying Volume Spikes for Algorithmic Filters in Crypto Markets
Understanding Volume Spikes in Cryptocurrency Trading
In the fast-paced world of cryptocurrency trading, volume spikes are a key indicator of market activity that can signal potential price movements or market anomalies. A volume spike occurs when there is a sudden and significant increase in trading volume over a short period. These surges often reflect heightened trader interest, news events, or large institutional trades. Recognizing and accurately quantifying these spikes is essential for developing effective algorithmic filters that can detect opportunities or warn traders about possible risks.
Volume spikes are particularly important because they often precede major price shifts. For example, an unexpected surge in buying volume might indicate strong bullish sentiment, while a sudden increase in sell orders could signal impending downward movement. Traders and investors rely on precise measurement techniques to distinguish genuine signals from random fluctuations, which helps improve decision-making and reduce false alarms.
Methods to Quantify Volume Spikes
There are several approaches used by traders and quantitative analysts to measure the intensity of volume spikes:
Absolute Volume: This straightforward method measures the total number of trades or total traded value within a specific time frame. When this number exceeds typical levels significantly, it indicates a potential spike.
Relative Volume: Comparing current trading activity against historical averages provides context—if current volume is many times higher than usual, it suggests an abnormal event worth noting.
Rate of Change (ROC): This metric calculates the percentage change between current volume and previous periods’ volumes. Rapid increases reflected by high ROC values point toward active market shifts.
Moving Averages (MA): Applying simple moving averages smooths out short-term fluctuations; when actual trading volumes jump above these averages sharply, it signals unusual activity.
Exponential Moving Averages (EMA): EMAs give more weight to recent data points compared to traditional MAs, making them more responsive to recent changes—ideal for real-time detection of spikes.
Bollinger Bands: By plotting standard deviations around a moving average line for volume data, Bollinger Bands help identify when trading activity moves beyond normal volatility ranges—an indicator of potential spikes.
Machine Learning Models: Advanced algorithms trained on historical data can recognize complex patterns associated with upcoming or ongoing volume surges. These models enhance predictive accuracy but require substantial data processing capabilities.
Recent Advances Enhancing Spike Detection
The evolution of technology has significantly improved how traders quantify and respond to volume spikes:
Advanced Data Analytics Tools — Modern analytics platforms enable rapid processing of vast datasets from multiple sources such as exchanges and blockchain networks. These tools facilitate real-time monitoring with high precision.
AI-Powered Trading Platforms — Artificial intelligence systems now integrate directly into trading environments; they automatically detect unusual activity patterns based on learned models without human intervention.
Blockchain Data Integration — Incorporating transparent blockchain transaction records enhances measurement accuracy since all transactions are publicly recorded and tamper-proof.
Real-Time Market Data Feeds — The availability of instant updates allows traders to react swiftly as soon as significant changes occur—crucial given crypto markets' volatility.
Regulatory Developments Promoting Transparency — Increased oversight ensures better quality data sources which underpin reliable quantification methods while reducing manipulation risks.
Challenges & Risks Associated with Quantifying Volume Spikes
Despite technological progress, accurately measuring these surges remains challenging due to several factors:
False Positives – Overly sensitive filters may trigger alerts during normal fluctuations leading to unnecessary trades or missed opportunities if ignored.
Market Manipulation – Traders employing tactics like wash trading artificially inflate volumes creating misleading signals designed solely for profit extraction at others’ expense.
Data Quality Issues – Incomplete or inaccurate datasets undermine analysis reliability; ensuring clean inputs is critical but not always straightforward across diverse platforms.
Regulatory Scrutiny – As authorities scrutinize crypto markets more closely postulate stricter rules around reporting standards affecting how data should be collected and used ethically.
Ethical Considerations – The deployment of sophisticated algorithms raises questions about fairness especially if certain participants leverage proprietary tools unfairly gaining advantages over less equipped counterparts.
Best Practices for Effective Quantification
To maximize benefits while minimizing pitfalls when analyzing volume spikes:
- Use multiple metrics simultaneously—for example combining relative volumes with ROC—to confirm signals before acting upon them.
- Incorporate machine learning models cautiously—they should complement traditional statistical methods rather than replace human judgment entirely.
- Maintain high-quality datasets by sourcing from reputable exchanges offering transparent transaction records aligned with regulatory standards.
- Regularly backtest algorithms against historical scenarios ensuring robustness across different market conditions.
Impact on Trading Strategies & Market Dynamics
Accurately detecting genuine volume spikes enables algorithmic strategies such as breakout detection systems that capitalize on momentum shifts early enough before prices fully move away from support/resistance levels—a crucial advantage given crypto markets' volatility profile.
Furthermore, understanding these surges helps mitigate risks associated with false signals caused by manipulative practices like spoofing where fake orders create artificial demand/supply impressions temporarily skewing perceived market sentiment.
Future Outlook & Ethical Considerations
Looking ahead, ongoing developments aim at refining spike detection through deeper integration between blockchain transparency tools and AI-driven analytics frameworks—all aimed at fostering fairer markets through better information symmetry.
However, ethical considerations remain paramount; transparency about algorithmic decision-making processes fosters trust among participants while regulators seek balanced oversight that prevents abuse without stifling innovation.
Summary
Quantifying cryptocurrency trade volume spikes involves leveraging various statistical techniques—from simple absolute measures up through sophisticated machine learning models—that help traders identify meaningful shifts amid noisy data streams effectively. Recent technological advancements have enhanced our ability to monitor these phenomena accurately but come bundled with challenges related to manipulation risks and ethical concerns requiring vigilant oversight.
By adopting best practices rooted in transparency—and continuously updating methodologies aligned with evolving regulations—market participants can harness the power of accurate spike detection responsibly within dynamic crypto ecosystems.
JCUSER-F1IIaxXA
2025-05-14 03:19
How can volume spikes be quantified for algorithmic filters?
Quantifying Volume Spikes for Algorithmic Filters in Crypto Markets
Understanding Volume Spikes in Cryptocurrency Trading
In the fast-paced world of cryptocurrency trading, volume spikes are a key indicator of market activity that can signal potential price movements or market anomalies. A volume spike occurs when there is a sudden and significant increase in trading volume over a short period. These surges often reflect heightened trader interest, news events, or large institutional trades. Recognizing and accurately quantifying these spikes is essential for developing effective algorithmic filters that can detect opportunities or warn traders about possible risks.
Volume spikes are particularly important because they often precede major price shifts. For example, an unexpected surge in buying volume might indicate strong bullish sentiment, while a sudden increase in sell orders could signal impending downward movement. Traders and investors rely on precise measurement techniques to distinguish genuine signals from random fluctuations, which helps improve decision-making and reduce false alarms.
Methods to Quantify Volume Spikes
There are several approaches used by traders and quantitative analysts to measure the intensity of volume spikes:
Absolute Volume: This straightforward method measures the total number of trades or total traded value within a specific time frame. When this number exceeds typical levels significantly, it indicates a potential spike.
Relative Volume: Comparing current trading activity against historical averages provides context—if current volume is many times higher than usual, it suggests an abnormal event worth noting.
Rate of Change (ROC): This metric calculates the percentage change between current volume and previous periods’ volumes. Rapid increases reflected by high ROC values point toward active market shifts.
Moving Averages (MA): Applying simple moving averages smooths out short-term fluctuations; when actual trading volumes jump above these averages sharply, it signals unusual activity.
Exponential Moving Averages (EMA): EMAs give more weight to recent data points compared to traditional MAs, making them more responsive to recent changes—ideal for real-time detection of spikes.
Bollinger Bands: By plotting standard deviations around a moving average line for volume data, Bollinger Bands help identify when trading activity moves beyond normal volatility ranges—an indicator of potential spikes.
Machine Learning Models: Advanced algorithms trained on historical data can recognize complex patterns associated with upcoming or ongoing volume surges. These models enhance predictive accuracy but require substantial data processing capabilities.
Recent Advances Enhancing Spike Detection
The evolution of technology has significantly improved how traders quantify and respond to volume spikes:
Advanced Data Analytics Tools — Modern analytics platforms enable rapid processing of vast datasets from multiple sources such as exchanges and blockchain networks. These tools facilitate real-time monitoring with high precision.
AI-Powered Trading Platforms — Artificial intelligence systems now integrate directly into trading environments; they automatically detect unusual activity patterns based on learned models without human intervention.
Blockchain Data Integration — Incorporating transparent blockchain transaction records enhances measurement accuracy since all transactions are publicly recorded and tamper-proof.
Real-Time Market Data Feeds — The availability of instant updates allows traders to react swiftly as soon as significant changes occur—crucial given crypto markets' volatility.
Regulatory Developments Promoting Transparency — Increased oversight ensures better quality data sources which underpin reliable quantification methods while reducing manipulation risks.
Challenges & Risks Associated with Quantifying Volume Spikes
Despite technological progress, accurately measuring these surges remains challenging due to several factors:
False Positives – Overly sensitive filters may trigger alerts during normal fluctuations leading to unnecessary trades or missed opportunities if ignored.
Market Manipulation – Traders employing tactics like wash trading artificially inflate volumes creating misleading signals designed solely for profit extraction at others’ expense.
Data Quality Issues – Incomplete or inaccurate datasets undermine analysis reliability; ensuring clean inputs is critical but not always straightforward across diverse platforms.
Regulatory Scrutiny – As authorities scrutinize crypto markets more closely postulate stricter rules around reporting standards affecting how data should be collected and used ethically.
Ethical Considerations – The deployment of sophisticated algorithms raises questions about fairness especially if certain participants leverage proprietary tools unfairly gaining advantages over less equipped counterparts.
Best Practices for Effective Quantification
To maximize benefits while minimizing pitfalls when analyzing volume spikes:
- Use multiple metrics simultaneously—for example combining relative volumes with ROC—to confirm signals before acting upon them.
- Incorporate machine learning models cautiously—they should complement traditional statistical methods rather than replace human judgment entirely.
- Maintain high-quality datasets by sourcing from reputable exchanges offering transparent transaction records aligned with regulatory standards.
- Regularly backtest algorithms against historical scenarios ensuring robustness across different market conditions.
Impact on Trading Strategies & Market Dynamics
Accurately detecting genuine volume spikes enables algorithmic strategies such as breakout detection systems that capitalize on momentum shifts early enough before prices fully move away from support/resistance levels—a crucial advantage given crypto markets' volatility profile.
Furthermore, understanding these surges helps mitigate risks associated with false signals caused by manipulative practices like spoofing where fake orders create artificial demand/supply impressions temporarily skewing perceived market sentiment.
Future Outlook & Ethical Considerations
Looking ahead, ongoing developments aim at refining spike detection through deeper integration between blockchain transparency tools and AI-driven analytics frameworks—all aimed at fostering fairer markets through better information symmetry.
However, ethical considerations remain paramount; transparency about algorithmic decision-making processes fosters trust among participants while regulators seek balanced oversight that prevents abuse without stifling innovation.
Summary
Quantifying cryptocurrency trade volume spikes involves leveraging various statistical techniques—from simple absolute measures up through sophisticated machine learning models—that help traders identify meaningful shifts amid noisy data streams effectively. Recent technological advancements have enhanced our ability to monitor these phenomena accurately but come bundled with challenges related to manipulation risks and ethical concerns requiring vigilant oversight.
By adopting best practices rooted in transparency—and continuously updating methodologies aligned with evolving regulations—market participants can harness the power of accurate spike detection responsibly within dynamic crypto ecosystems.
Disclaimer:Contains third-party content. Not financial advice.
See Terms and Conditions.
What Are Central Bank Digital Currencies (CBDCs)?
Central Bank Digital Currencies (CBDCs) are transforming the landscape of global finance. As digital innovations reshape how we conduct transactions, understanding what CBDCs are and their implications becomes essential for consumers, businesses, and policymakers alike. This article provides a comprehensive overview of CBDCs, exploring their definition, development status worldwide, benefits, challenges, and future prospects.
Understanding CBDCs: Definition and Core Features
CBDCs are digital versions of fiat currencies issued directly by a country's central bank. Unlike cryptocurrencies such as Bitcoin or Ethereum—which operate on decentralized networks—CBDCs are centralized digital currencies backed by the government’s credit. They aim to replicate physical cash in a digital format while leveraging modern technology to enhance security and efficiency.
Key characteristics include:
- Issuer: Central banks issue CBDCs.
- Backing: Fully backed by government authority.
- Control: Managed centrally without decentralization.
- Security Measures: Employ advanced cryptography to prevent counterfeiting.
- Regulatory Compliance: Designed to adhere strictly to AML (Anti-Money Laundering) and KYC (Know Your Customer) regulations.
This structure ensures that CBDCs maintain trustworthiness comparable to traditional fiat currency but with the advantages of digital technology.
Why Are Central Banks Developing Digital Currencies?
The push toward CBDC adoption stems from multiple factors influencing modern economies:
- Digital Payment Growth: The surge in online transactions demands faster and more efficient payment systems.
- Cryptocurrency Trends: The rise of private cryptocurrencies has prompted governments to develop official digital alternatives that can be regulated effectively.
- Financial Inclusion: Many unbanked populations lack access to traditional banking services; CBDCs could bridge this gap by providing accessible digital financial tools via smartphones or other devices.
- Monetary Policy Tools: Digital currencies offer new avenues for central banks to implement monetary policy more precisely.
By embracing these innovations, central banks aim not only at modernization but also at safeguarding monetary sovereignty amid evolving financial ecosystems.
Global Progress on CBDC Implementation
Several countries have made significant strides in developing or piloting their own versions of CBDC:
China’s Digital Yuan
China is arguably leading the world with its pilot program launched in 2020. Known as the e-CNY or digital yuan, it is designed for everyday use alongside physical cash within China’s existing financial infrastructure[1]. The project aims at enhancing transaction speed while maintaining strict regulatory oversight.
European Central Bank's Digital Euro Initiative
The ECB has been exploring a potential euro-based digital currency since 2022[2]. Its focus lies in ensuring compatibility with current banking systems while addressing privacy concerns and regulatory frameworks necessary for widespread adoption across Europe.
United States Federal Reserve Studies
While still in research phases as of 2023[3], the U.S. Federal Reserve is examining how a potential dollar-backed CBDC could influence monetary policy stability without disrupting existing financial markets.
International Collaboration & Guidance
Organizations like the Bank for International Settlements (BIS) facilitate cooperation among central banks worldwide[4]. Their guidance helps harmonize standards around security protocols, interoperability between different national currencies’ blockchain platforms, and regulatory approaches—paving way for smoother cross-border transactions involving multiple jurisdictions' CBDCs.
Benefits Offered by Central Bank Digital Currencies
Implementing a well-designed CBDC can bring numerous advantages:
Enhanced Transaction Efficiency: Faster settlement times reduce delays associated with traditional banking processes.
Reduced Costs: Eliminating intermediaries lowers transaction fees both domestically and internationally.
Improved Financial Inclusion: Providing accessible access points via mobile devices allows underserved populations entry into formal financial systems.
Strengthened Monetary Policy Tools: Real-time data collection enables more precise adjustments based on economic indicators derived from transaction patterns.
Counteracting Private Cryptocurrencies’ Volatility
Furthermore, because they are regulated entities backed by governments rather than decentralized networks prone to volatility like Bitcoin or Ethereum—they provide stability crucial during economic uncertainties.
Challenges & Risks Associated With CBDC Adoption
Despite promising benefits, several hurdles must be addressed before widespread implementation:
Privacy Concerns
As all transactions conducted through a central bank-issued wallet would generate data stored securely under government oversight—raising fears about surveillance capabilities infringing on individual privacy rights[5].
Regulatory Complexities
Adapting existing legal frameworks such as AML/KYC laws requires significant updates; ensuring compliance across borders adds further complexity especially when considering cross-currency operations involving multiple jurisdictions’ regulations[6].
Cybersecurity Threats
Digital assets inherently face risks related to hacking attempts targeting critical infrastructure—necessitating robust cybersecurity measures that evolve alongside technological advancements[7].
Potential Disruption To Banking Sector
If consumers prefer holding funds directly with central banks via wallets rather than commercial banks—a scenario known as disintermediation—it could impact traditional banking models adversely including job losses within retail banking sectors.
Future Outlook & Strategic Considerations
As interest grows globally—with countries like China already piloting programs—the landscape suggests an increasing likelihood that many nations will adopt some form of retail or wholesale CBDC over coming years. Key considerations include:
Ensuring interoperability between different countries' digital currencies facilitates seamless cross-border payments—a vital aspect given globalization trends.[8]
Balancing privacy protections against anti-fraud measures remains critical; transparent yet secure data management policies will shape public trust.[9]
Collaboration among regulators worldwide can help establish common standards reducing fragmentation risks.[10]
Ultimately, successful integration depends on aligning technological innovation with sound regulation while maintaining public confidence through transparency.
Understanding what constitutes a Central Bank Digital Currency reveals its potential transformative impact on global finance—from improving payment efficiency and promoting inclusion to reshaping monetary policy tools—all underpinned by rigorous regulation aimed at safeguarding stability amidst rapid technological change.[11] As developments continue apace across major economies—and international cooperation deepens—the future role of CBDCs promises both opportunities and challenges worth watching closely.
References
- People's Bank of China Official Reports
- European Central Bank Publications
- Federal Reserve Research Papers
- BIS Reports on Cross-Border Payments5–11 Various academic articles discussing privacy issues, cybersecurity threats, regulatory frameworks etc., up-to-date until October 2023
JCUSER-IC8sJL1q
2025-05-11 13:50
What are central bank digital currencies (CBDCs)?
What Are Central Bank Digital Currencies (CBDCs)?
Central Bank Digital Currencies (CBDCs) are transforming the landscape of global finance. As digital innovations reshape how we conduct transactions, understanding what CBDCs are and their implications becomes essential for consumers, businesses, and policymakers alike. This article provides a comprehensive overview of CBDCs, exploring their definition, development status worldwide, benefits, challenges, and future prospects.
Understanding CBDCs: Definition and Core Features
CBDCs are digital versions of fiat currencies issued directly by a country's central bank. Unlike cryptocurrencies such as Bitcoin or Ethereum—which operate on decentralized networks—CBDCs are centralized digital currencies backed by the government’s credit. They aim to replicate physical cash in a digital format while leveraging modern technology to enhance security and efficiency.
Key characteristics include:
- Issuer: Central banks issue CBDCs.
- Backing: Fully backed by government authority.
- Control: Managed centrally without decentralization.
- Security Measures: Employ advanced cryptography to prevent counterfeiting.
- Regulatory Compliance: Designed to adhere strictly to AML (Anti-Money Laundering) and KYC (Know Your Customer) regulations.
This structure ensures that CBDCs maintain trustworthiness comparable to traditional fiat currency but with the advantages of digital technology.
Why Are Central Banks Developing Digital Currencies?
The push toward CBDC adoption stems from multiple factors influencing modern economies:
- Digital Payment Growth: The surge in online transactions demands faster and more efficient payment systems.
- Cryptocurrency Trends: The rise of private cryptocurrencies has prompted governments to develop official digital alternatives that can be regulated effectively.
- Financial Inclusion: Many unbanked populations lack access to traditional banking services; CBDCs could bridge this gap by providing accessible digital financial tools via smartphones or other devices.
- Monetary Policy Tools: Digital currencies offer new avenues for central banks to implement monetary policy more precisely.
By embracing these innovations, central banks aim not only at modernization but also at safeguarding monetary sovereignty amid evolving financial ecosystems.
Global Progress on CBDC Implementation
Several countries have made significant strides in developing or piloting their own versions of CBDC:
China’s Digital Yuan
China is arguably leading the world with its pilot program launched in 2020. Known as the e-CNY or digital yuan, it is designed for everyday use alongside physical cash within China’s existing financial infrastructure[1]. The project aims at enhancing transaction speed while maintaining strict regulatory oversight.
European Central Bank's Digital Euro Initiative
The ECB has been exploring a potential euro-based digital currency since 2022[2]. Its focus lies in ensuring compatibility with current banking systems while addressing privacy concerns and regulatory frameworks necessary for widespread adoption across Europe.
United States Federal Reserve Studies
While still in research phases as of 2023[3], the U.S. Federal Reserve is examining how a potential dollar-backed CBDC could influence monetary policy stability without disrupting existing financial markets.
International Collaboration & Guidance
Organizations like the Bank for International Settlements (BIS) facilitate cooperation among central banks worldwide[4]. Their guidance helps harmonize standards around security protocols, interoperability between different national currencies’ blockchain platforms, and regulatory approaches—paving way for smoother cross-border transactions involving multiple jurisdictions' CBDCs.
Benefits Offered by Central Bank Digital Currencies
Implementing a well-designed CBDC can bring numerous advantages:
Enhanced Transaction Efficiency: Faster settlement times reduce delays associated with traditional banking processes.
Reduced Costs: Eliminating intermediaries lowers transaction fees both domestically and internationally.
Improved Financial Inclusion: Providing accessible access points via mobile devices allows underserved populations entry into formal financial systems.
Strengthened Monetary Policy Tools: Real-time data collection enables more precise adjustments based on economic indicators derived from transaction patterns.
Counteracting Private Cryptocurrencies’ Volatility
Furthermore, because they are regulated entities backed by governments rather than decentralized networks prone to volatility like Bitcoin or Ethereum—they provide stability crucial during economic uncertainties.
Challenges & Risks Associated With CBDC Adoption
Despite promising benefits, several hurdles must be addressed before widespread implementation:
Privacy Concerns
As all transactions conducted through a central bank-issued wallet would generate data stored securely under government oversight—raising fears about surveillance capabilities infringing on individual privacy rights[5].
Regulatory Complexities
Adapting existing legal frameworks such as AML/KYC laws requires significant updates; ensuring compliance across borders adds further complexity especially when considering cross-currency operations involving multiple jurisdictions’ regulations[6].
Cybersecurity Threats
Digital assets inherently face risks related to hacking attempts targeting critical infrastructure—necessitating robust cybersecurity measures that evolve alongside technological advancements[7].
Potential Disruption To Banking Sector
If consumers prefer holding funds directly with central banks via wallets rather than commercial banks—a scenario known as disintermediation—it could impact traditional banking models adversely including job losses within retail banking sectors.
Future Outlook & Strategic Considerations
As interest grows globally—with countries like China already piloting programs—the landscape suggests an increasing likelihood that many nations will adopt some form of retail or wholesale CBDC over coming years. Key considerations include:
Ensuring interoperability between different countries' digital currencies facilitates seamless cross-border payments—a vital aspect given globalization trends.[8]
Balancing privacy protections against anti-fraud measures remains critical; transparent yet secure data management policies will shape public trust.[9]
Collaboration among regulators worldwide can help establish common standards reducing fragmentation risks.[10]
Ultimately, successful integration depends on aligning technological innovation with sound regulation while maintaining public confidence through transparency.
Understanding what constitutes a Central Bank Digital Currency reveals its potential transformative impact on global finance—from improving payment efficiency and promoting inclusion to reshaping monetary policy tools—all underpinned by rigorous regulation aimed at safeguarding stability amidst rapid technological change.[11] As developments continue apace across major economies—and international cooperation deepens—the future role of CBDCs promises both opportunities and challenges worth watching closely.
References
- People's Bank of China Official Reports
- European Central Bank Publications
- Federal Reserve Research Papers
- BIS Reports on Cross-Border Payments5–11 Various academic articles discussing privacy issues, cybersecurity threats, regulatory frameworks etc., up-to-date until October 2023
Disclaimer:Contains third-party content. Not financial advice.
See Terms and Conditions.
Risks and Challenges of Using Bitcoin: A Comprehensive Overview
Bitcoin has revolutionized the financial landscape since its creation in 2009, offering a decentralized alternative to traditional currencies. Its appeal lies in its potential for high returns, privacy features, and the promise of a borderless financial system. However, alongside these advantages come significant risks and challenges that investors and users must understand to navigate the crypto space effectively.
Financial Risks Associated with Bitcoin
One of the most prominent concerns surrounding Bitcoin is its extreme price volatility. Unlike fiat currencies backed by governments or commodities like gold, Bitcoin's value can fluctuate dramatically within short periods. For example, in recent years, it has experienced rapid surges followed by sharp declines—making it difficult for traders to predict future prices accurately. This volatility can lead to substantial financial losses for investors who buy at peak prices or sell during downturns.
Market manipulation is another risk stemming from the largely unregulated nature of cryptocurrency markets. Without comprehensive oversight from regulatory bodies like those governing traditional finance sectors, malicious actors can influence prices through tactics such as pump-and-dump schemes or coordinated trading activities. Such practices distort market signals and pose risks for retail investors unfamiliar with these manipulative strategies.
Regulatory uncertainty remains a critical challenge impacting Bitcoin’s stability and adoption rates. Governments worldwide are still formulating policies regarding cryptocurrencies; sudden regulatory changes—such as bans or stricter compliance requirements—can cause abrupt price drops or restrict access altogether. For instance, recent developments like the repeal of certain IRS rules on decentralized finance (DeFi) platforms have created both opportunities and uncertainties within this evolving legal landscape.
Investment Challenges When Using Bitcoin
Unlike traditional assets supported by institutions like banks or governments, Bitcoin lacks centralized backing that guarantees its value stability. This absence means that investor confidence heavily depends on market sentiment rather than intrinsic backing—a factor contributing to its high volatility.
Security concerns also pose significant hurdles for users engaging with Bitcoin transactions. While blockchain technology offers a secure ledger system resistant to tampering under ideal conditions, vulnerabilities exist elsewhere in the ecosystem—for example, through hacking exchanges or phishing scams targeting individual wallets. Recent incidents involving cyber espionage groups exploiting weaknesses highlight ongoing security threats faced by crypto users globally.
Furthermore, scams remain prevalent due to the decentralized nature of cryptocurrencies which makes regulation enforcement challenging. Fraudulent schemes such as fake investment platforms or Ponzi schemes lure unsuspecting investors into losing their funds without recourse—a stark reminder that due diligence is essential when dealing with digital assets.
Blockchain Technology Challenges Impacting Adoption
Bitcoin’s underlying blockchain technology faces several technical limitations affecting scalability and usability:
- Scalability Issues: The current infrastructure struggles under increasing transaction volumes; network congestion leads to slower processing times and higher fees during peak periods.
- Energy Consumption: Mining operations require substantial computational power—often consuming energy comparable to small countries—which raises environmental concerns amid global efforts toward sustainability.
- Interoperability Gaps: Limited compatibility between different blockchain networks hampers seamless asset transfers across platforms—a barrier for broader mainstream adoption where interoperability is key.
Addressing these technological challenges requires ongoing innovation within blockchain development communities but remains an obstacle until solutions are widely implemented.
Recent Developments Shaping the Crypto Landscape
The year 2025 has been pivotal in shaping perceptions around Bitcoin’s risks:
In April 2025, Bitcoin's price surged past $94,000 driven partly by increased inflows into exchange-traded funds (ETFs) and easing geopolitical tensions such as cooling-off periods related to trade conflicts.
Regulatory reforms marked a turning point when authorities repealed restrictive IRS rules concerning DeFi platforms; this move aimed at fostering innovation while balancing compliance demands.
Security threats persistently evolve: North Korean cyber spies reportedly established U.S.-based firms targeting cryptocurrency exchanges through sophisticated hacking campaigns—highlighting persistent cybersecurity vulnerabilities within crypto ecosystems.
These developments underscore how rapidly market dynamics shift based on technological advances and policy changes—and why staying informed is crucial for participants at all levels.
Potential Fallout from Current Risks
Given these intertwined risks—from market volatility to security breaches—the potential fallout could be severe:
Market Crashes: Sudden downturns triggered by regulatory crackdowns or large-scale sell-offs could wipe out significant portions of investor wealth.
Regulatory Clampdowns: Governments may impose stricter controls if they perceive cryptocurrencies threaten monetary systems’ stability—potentially leading to bans or restrictions that diminish usability.
Security Breaches Eroding Trust: Continued hacking incidents undermine confidence among users; diminished trust can slow adoption rates further impacting liquidity and valuation over time.
Understanding these possible outcomes helps stakeholders prepare contingency plans while advocating responsible regulation aligned with technological progress.
Navigating Risks: Best Practices for Users & Investors
To mitigate exposure:
- Conduct thorough research before investing—in particular understanding project fundamentals,
- Use reputable wallets & exchanges with robust security measures,3.. Stay updated on regulatory developments relevant in your jurisdiction,4.. Diversify holdings across different assets beyond just cryptocurrencies,5.. Be cautious about speculative investments driven solely by hype rather than fundamentals,
By adopting prudent strategies rooted in awareness of inherent risks—and leveraging trusted sources—you can better position yourself amidst an evolving crypto environment filled with both opportunity and peril.
Final Thoughts: Balancing Innovation With Caution
Bitcoin continues transforming how we think about money—but it does so amid complex challenges requiring careful consideration from all participants involved—from individual traders up to policymakers worldwide . Recognizing associated risks—including volatility fluctuations , security vulnerabilities , scalability hurdles ,and uncertain regulations—is essential not only for safeguarding investments but also fostering sustainable growth within this innovative sector .
Staying informed about recent developments ensures you’re prepared against potential fallout while contributing positively toward shaping responsible frameworks that support innovation without compromising safety standards.
Keywords: bitcoin risks , cryptocurrency challenges , blockchain scalability issues , crypto security threats , bitcoin regulation updates
JCUSER-IC8sJL1q
2025-05-06 08:13
What are the risks and challenges associated with using Bitcoin?
Risks and Challenges of Using Bitcoin: A Comprehensive Overview
Bitcoin has revolutionized the financial landscape since its creation in 2009, offering a decentralized alternative to traditional currencies. Its appeal lies in its potential for high returns, privacy features, and the promise of a borderless financial system. However, alongside these advantages come significant risks and challenges that investors and users must understand to navigate the crypto space effectively.
Financial Risks Associated with Bitcoin
One of the most prominent concerns surrounding Bitcoin is its extreme price volatility. Unlike fiat currencies backed by governments or commodities like gold, Bitcoin's value can fluctuate dramatically within short periods. For example, in recent years, it has experienced rapid surges followed by sharp declines—making it difficult for traders to predict future prices accurately. This volatility can lead to substantial financial losses for investors who buy at peak prices or sell during downturns.
Market manipulation is another risk stemming from the largely unregulated nature of cryptocurrency markets. Without comprehensive oversight from regulatory bodies like those governing traditional finance sectors, malicious actors can influence prices through tactics such as pump-and-dump schemes or coordinated trading activities. Such practices distort market signals and pose risks for retail investors unfamiliar with these manipulative strategies.
Regulatory uncertainty remains a critical challenge impacting Bitcoin’s stability and adoption rates. Governments worldwide are still formulating policies regarding cryptocurrencies; sudden regulatory changes—such as bans or stricter compliance requirements—can cause abrupt price drops or restrict access altogether. For instance, recent developments like the repeal of certain IRS rules on decentralized finance (DeFi) platforms have created both opportunities and uncertainties within this evolving legal landscape.
Investment Challenges When Using Bitcoin
Unlike traditional assets supported by institutions like banks or governments, Bitcoin lacks centralized backing that guarantees its value stability. This absence means that investor confidence heavily depends on market sentiment rather than intrinsic backing—a factor contributing to its high volatility.
Security concerns also pose significant hurdles for users engaging with Bitcoin transactions. While blockchain technology offers a secure ledger system resistant to tampering under ideal conditions, vulnerabilities exist elsewhere in the ecosystem—for example, through hacking exchanges or phishing scams targeting individual wallets. Recent incidents involving cyber espionage groups exploiting weaknesses highlight ongoing security threats faced by crypto users globally.
Furthermore, scams remain prevalent due to the decentralized nature of cryptocurrencies which makes regulation enforcement challenging. Fraudulent schemes such as fake investment platforms or Ponzi schemes lure unsuspecting investors into losing their funds without recourse—a stark reminder that due diligence is essential when dealing with digital assets.
Blockchain Technology Challenges Impacting Adoption
Bitcoin’s underlying blockchain technology faces several technical limitations affecting scalability and usability:
- Scalability Issues: The current infrastructure struggles under increasing transaction volumes; network congestion leads to slower processing times and higher fees during peak periods.
- Energy Consumption: Mining operations require substantial computational power—often consuming energy comparable to small countries—which raises environmental concerns amid global efforts toward sustainability.
- Interoperability Gaps: Limited compatibility between different blockchain networks hampers seamless asset transfers across platforms—a barrier for broader mainstream adoption where interoperability is key.
Addressing these technological challenges requires ongoing innovation within blockchain development communities but remains an obstacle until solutions are widely implemented.
Recent Developments Shaping the Crypto Landscape
The year 2025 has been pivotal in shaping perceptions around Bitcoin’s risks:
In April 2025, Bitcoin's price surged past $94,000 driven partly by increased inflows into exchange-traded funds (ETFs) and easing geopolitical tensions such as cooling-off periods related to trade conflicts.
Regulatory reforms marked a turning point when authorities repealed restrictive IRS rules concerning DeFi platforms; this move aimed at fostering innovation while balancing compliance demands.
Security threats persistently evolve: North Korean cyber spies reportedly established U.S.-based firms targeting cryptocurrency exchanges through sophisticated hacking campaigns—highlighting persistent cybersecurity vulnerabilities within crypto ecosystems.
These developments underscore how rapidly market dynamics shift based on technological advances and policy changes—and why staying informed is crucial for participants at all levels.
Potential Fallout from Current Risks
Given these intertwined risks—from market volatility to security breaches—the potential fallout could be severe:
Market Crashes: Sudden downturns triggered by regulatory crackdowns or large-scale sell-offs could wipe out significant portions of investor wealth.
Regulatory Clampdowns: Governments may impose stricter controls if they perceive cryptocurrencies threaten monetary systems’ stability—potentially leading to bans or restrictions that diminish usability.
Security Breaches Eroding Trust: Continued hacking incidents undermine confidence among users; diminished trust can slow adoption rates further impacting liquidity and valuation over time.
Understanding these possible outcomes helps stakeholders prepare contingency plans while advocating responsible regulation aligned with technological progress.
Navigating Risks: Best Practices for Users & Investors
To mitigate exposure:
- Conduct thorough research before investing—in particular understanding project fundamentals,
- Use reputable wallets & exchanges with robust security measures,3.. Stay updated on regulatory developments relevant in your jurisdiction,4.. Diversify holdings across different assets beyond just cryptocurrencies,5.. Be cautious about speculative investments driven solely by hype rather than fundamentals,
By adopting prudent strategies rooted in awareness of inherent risks—and leveraging trusted sources—you can better position yourself amidst an evolving crypto environment filled with both opportunity and peril.
Final Thoughts: Balancing Innovation With Caution
Bitcoin continues transforming how we think about money—but it does so amid complex challenges requiring careful consideration from all participants involved—from individual traders up to policymakers worldwide . Recognizing associated risks—including volatility fluctuations , security vulnerabilities , scalability hurdles ,and uncertain regulations—is essential not only for safeguarding investments but also fostering sustainable growth within this innovative sector .
Staying informed about recent developments ensures you’re prepared against potential fallout while contributing positively toward shaping responsible frameworks that support innovation without compromising safety standards.
Keywords: bitcoin risks , cryptocurrency challenges , blockchain scalability issues , crypto security threats , bitcoin regulation updates
Disclaimer:Contains third-party content. Not financial advice.
See Terms and Conditions.
#Render glisse sous sa structure en triangle et approche la zone de demande $3.05–$3.25.
📊 Scénarios à surveiller : ✅ Si ça tient → possible rebond court terme vers $4.00+ 🚀 ❌ Si ça casse → chute probable vers la zone $2.50–$2.70 ⚠️
👉 Selon vous, $RNDR prépare un rebond solide ou une plongée plus profonde ?
#RNDR #AI #CryptoMarkets
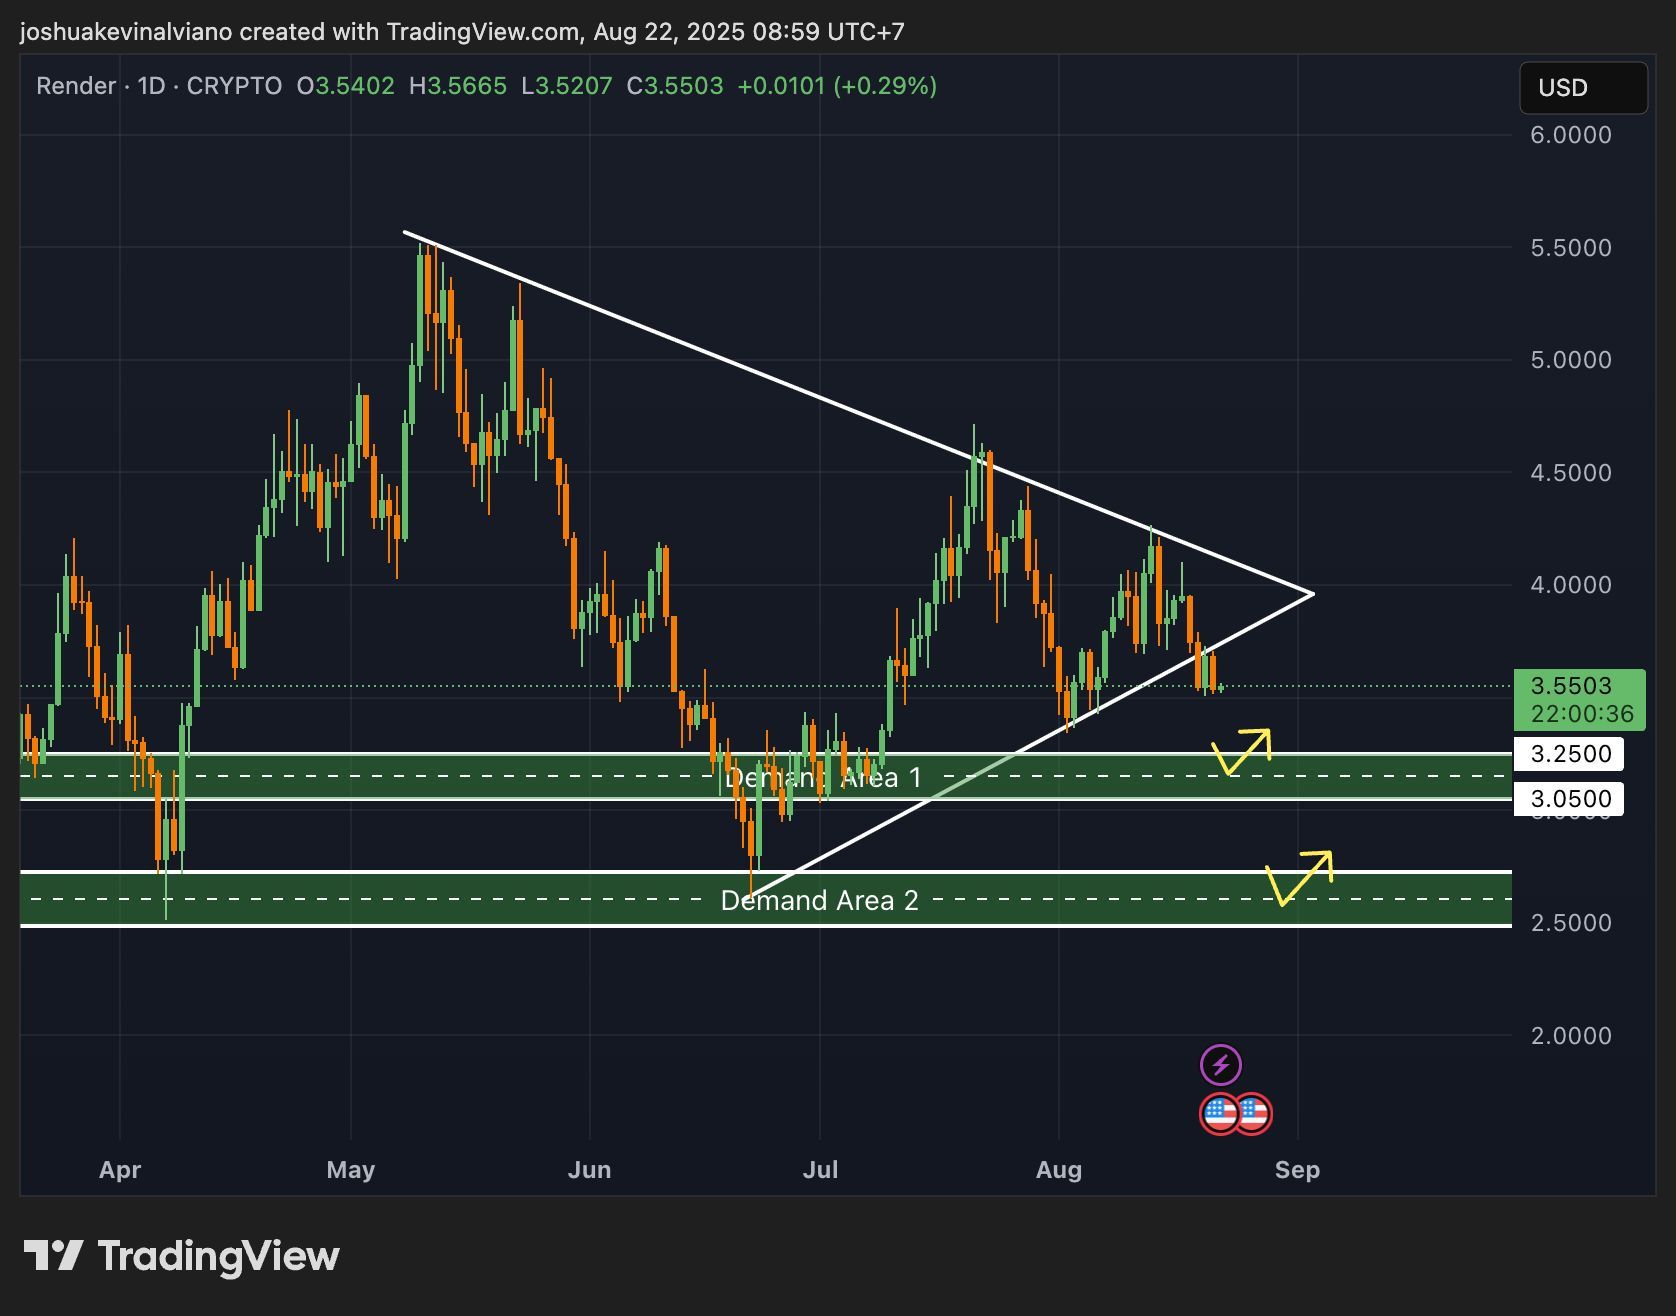

Carmelita
2025-08-22 11:50
$RNDR en zone critique : rebond ou cassure ?
Disclaimer:Contains third-party content. Not financial advice.
See Terms and Conditions.
How is On-Chain Data Visualized?
Understanding how on-chain data is visualized is essential for anyone interested in blockchain technology, whether you're an investor, developer, or researcher. As blockchain networks generate vast amounts of data daily, transforming this raw information into understandable visuals helps users make informed decisions and gain insights into network health and activity. This article explores the main methods and tools used to visualize on-chain data effectively.
What Is On-Chain Data?
On-chain data encompasses all information stored directly on a blockchain. This includes transaction records, smart contract interactions, token movements, network metrics like block times and gas fees, as well as overall network activity. Because this data is decentralized and transparent by design—meaning anyone can verify transactions—it serves as a reliable source for analysis. However, its sheer volume can be overwhelming without proper visualization techniques.
Why Visualize On-Chain Data?
The exponential growth of blockchain networks has led to an increase in both the quantity and complexity of on-chain data. For users trying to interpret trends or detect anomalies—such as unusual transaction spikes or potential security breaches—visualization becomes indispensable. Well-designed visual representations help distill complex datasets into digestible formats that facilitate quick understanding and better decision-making.
Common Techniques for Visualizing On-Chain Data
There are several key methods used to represent on-chain information visually:
Transaction Volume & Frequency Charts
These graphs display the number of transactions over specific periods (daily or hourly). They reveal patterns such as peak activity times or seasonal fluctuations in network usage.Smart Contract Interaction Graphs
Visualizations showing how often certain smart contracts are called provide insights into dApp popularity and performance trends within decentralized applications (dApps).Network Metrics Dashboards
Metrics like average block time, transaction fees (gas prices), total active addresses, and hash rates are often displayed through line charts or heatmaps to assess network health.Tokenomics Visualization
Charts illustrating token supply distribution—such as pie charts showing holder concentration—or circulation metrics help investors understand market dynamics like scarcity or inflation rates.
Tools & Platforms for On-Chain Data Visualization
A variety of tools have emerged to aid users in visualizing blockchain data efficiently:
- Etherscan: Primarily focused on Ethereum-based networks; offers detailed transaction histories along with smart contract interaction logs.
- Chainalysis: Provides comprehensive analytics dashboards suitable for institutional clients seeking deep insights across multiple chains.
- CryptoSlate: Offers real-time price tracking combined with basic visualization features covering various cryptocurrencies.
- Google Data Studio: A versatile platform allowing analysts to create custom dashboards by importing raw blockchain datasets from APIs or CSV files.
Recent Innovations in Visualization Techniques
The integration of artificial intelligence (AI) and machine learning (ML) has revolutionized how we interpret on-chain data today:
- AI algorithms can automatically identify unusual patterns indicative of potential security threats such as hacks or fraud.
- Machine learning models enhance predictive analytics—for example predicting future transaction volumes based on historical trends.
These advancements enable more accurate anomaly detection while providing deeper insights that were previously difficult due to manual analysis limitations.
Adoption Trends Among Investors & Regulators
Institutional investors increasingly rely on sophisticated visualization tools when evaluating crypto assets because they demand transparency before committing capital. These tools help them assess risks by providing clear views into transactional flows and wallet activities—a critical factor amid growing regulatory scrutiny worldwide.
Regulators also benefit from improved visualization capabilities; transparent representations assist authorities in monitoring compliance with anti-money laundering (AML) standards while ensuring market integrity through clear audit trails embedded within these visualizations.
Potential Challenges & Ethical Considerations
Despite their benefits, there are challenges associated with relying heavily on visualization tools:
• Security Risks: Centralized platforms storing sensitive analytical data could become targets for cyberattacks if not properly secured.• Information Overload: The abundance of available datasets may overwhelm users unless filtering mechanisms are implemented effectively.• Ethical Concerns: AI-driven analyses might introduce biases if training datasets aren’t representative; maintaining transparency about methodologies is crucial for trustworthiness.
Key Facts About On-Chain Data Visualization
To appreciate its importance fully:
– Blockchain networks have expanded rapidly since 2017; this growth correlates directly with increased volume in stored transactional information.– Daily transaction volumes across major chains like Ethereum have surged over 500% since 2020.– Institutional interest continues rising—with many investing heavily in analytics firms specializing in blockchain intelligence—to leverage these visualizations strategically during investment processes.
Timeline Highlights
2017: The surge of initial coin offerings (ICOs) led to a spike in generated chain activity requiring better visualization solutions.*
2020: The COVID pandemic accelerated adoption due to increased digital asset trading.*
2023: AI-powered visualization tools became mainstream components within industry-standard platforms.
Final Thoughts
Visualizing on-chain data transforms complex raw information into actionable insights that support smarter decision-making across the crypto ecosystem—from individual traders analyzing market trends to institutions managing risk exposure—and enhances transparency vital for regulatory compliance. As technological innovations continue advancing—including AI integration—the capacity for more accurate real-time analysis will grow further while addressing current challenges related to security risks and ethical considerations remains essential for building trust within this rapidly evolving space.
JCUSER-WVMdslBw
2025-05-26 17:52
How is on-chain data visualized?
How is On-Chain Data Visualized?
Understanding how on-chain data is visualized is essential for anyone interested in blockchain technology, whether you're an investor, developer, or researcher. As blockchain networks generate vast amounts of data daily, transforming this raw information into understandable visuals helps users make informed decisions and gain insights into network health and activity. This article explores the main methods and tools used to visualize on-chain data effectively.
What Is On-Chain Data?
On-chain data encompasses all information stored directly on a blockchain. This includes transaction records, smart contract interactions, token movements, network metrics like block times and gas fees, as well as overall network activity. Because this data is decentralized and transparent by design—meaning anyone can verify transactions—it serves as a reliable source for analysis. However, its sheer volume can be overwhelming without proper visualization techniques.
Why Visualize On-Chain Data?
The exponential growth of blockchain networks has led to an increase in both the quantity and complexity of on-chain data. For users trying to interpret trends or detect anomalies—such as unusual transaction spikes or potential security breaches—visualization becomes indispensable. Well-designed visual representations help distill complex datasets into digestible formats that facilitate quick understanding and better decision-making.
Common Techniques for Visualizing On-Chain Data
There are several key methods used to represent on-chain information visually:
Transaction Volume & Frequency Charts
These graphs display the number of transactions over specific periods (daily or hourly). They reveal patterns such as peak activity times or seasonal fluctuations in network usage.Smart Contract Interaction Graphs
Visualizations showing how often certain smart contracts are called provide insights into dApp popularity and performance trends within decentralized applications (dApps).Network Metrics Dashboards
Metrics like average block time, transaction fees (gas prices), total active addresses, and hash rates are often displayed through line charts or heatmaps to assess network health.Tokenomics Visualization
Charts illustrating token supply distribution—such as pie charts showing holder concentration—or circulation metrics help investors understand market dynamics like scarcity or inflation rates.
Tools & Platforms for On-Chain Data Visualization
A variety of tools have emerged to aid users in visualizing blockchain data efficiently:
- Etherscan: Primarily focused on Ethereum-based networks; offers detailed transaction histories along with smart contract interaction logs.
- Chainalysis: Provides comprehensive analytics dashboards suitable for institutional clients seeking deep insights across multiple chains.
- CryptoSlate: Offers real-time price tracking combined with basic visualization features covering various cryptocurrencies.
- Google Data Studio: A versatile platform allowing analysts to create custom dashboards by importing raw blockchain datasets from APIs or CSV files.
Recent Innovations in Visualization Techniques
The integration of artificial intelligence (AI) and machine learning (ML) has revolutionized how we interpret on-chain data today:
- AI algorithms can automatically identify unusual patterns indicative of potential security threats such as hacks or fraud.
- Machine learning models enhance predictive analytics—for example predicting future transaction volumes based on historical trends.
These advancements enable more accurate anomaly detection while providing deeper insights that were previously difficult due to manual analysis limitations.
Adoption Trends Among Investors & Regulators
Institutional investors increasingly rely on sophisticated visualization tools when evaluating crypto assets because they demand transparency before committing capital. These tools help them assess risks by providing clear views into transactional flows and wallet activities—a critical factor amid growing regulatory scrutiny worldwide.
Regulators also benefit from improved visualization capabilities; transparent representations assist authorities in monitoring compliance with anti-money laundering (AML) standards while ensuring market integrity through clear audit trails embedded within these visualizations.
Potential Challenges & Ethical Considerations
Despite their benefits, there are challenges associated with relying heavily on visualization tools:
• Security Risks: Centralized platforms storing sensitive analytical data could become targets for cyberattacks if not properly secured.• Information Overload: The abundance of available datasets may overwhelm users unless filtering mechanisms are implemented effectively.• Ethical Concerns: AI-driven analyses might introduce biases if training datasets aren’t representative; maintaining transparency about methodologies is crucial for trustworthiness.
Key Facts About On-Chain Data Visualization
To appreciate its importance fully:
– Blockchain networks have expanded rapidly since 2017; this growth correlates directly with increased volume in stored transactional information.– Daily transaction volumes across major chains like Ethereum have surged over 500% since 2020.– Institutional interest continues rising—with many investing heavily in analytics firms specializing in blockchain intelligence—to leverage these visualizations strategically during investment processes.
Timeline Highlights
2017: The surge of initial coin offerings (ICOs) led to a spike in generated chain activity requiring better visualization solutions.*
2020: The COVID pandemic accelerated adoption due to increased digital asset trading.*
2023: AI-powered visualization tools became mainstream components within industry-standard platforms.
Final Thoughts
Visualizing on-chain data transforms complex raw information into actionable insights that support smarter decision-making across the crypto ecosystem—from individual traders analyzing market trends to institutions managing risk exposure—and enhances transparency vital for regulatory compliance. As technological innovations continue advancing—including AI integration—the capacity for more accurate real-time analysis will grow further while addressing current challenges related to security risks and ethical considerations remains essential for building trust within this rapidly evolving space.
Disclaimer:Contains third-party content. Not financial advice.
See Terms and Conditions.
How Strict Is Binance’s KYC Process?
Understanding the level of strictness in Binance’s Know Your Customer (KYC) procedures is essential for users, regulators, and industry observers alike. As one of the world’s largest cryptocurrency exchanges, Binance operates within a complex regulatory landscape that demands rigorous compliance measures. This article explores how stringent Binance’s KYC process is, what it entails, recent developments influencing its policies, and the implications for users and the platform itself.
What Does KYC Mean for Cryptocurrency Exchanges?
KYC stands for "Know Your Customer," a fundamental component of financial regulation designed to verify customer identities. For crypto exchanges like Binance, implementing effective KYC protocols helps prevent illegal activities such as money laundering, terrorist financing, and fraud. These procedures are mandated by international standards set by organizations like the Financial Action Task Force (FATF) and are enforced differently across jurisdictions.
In practice, KYC involves collecting personal identification documents—passports, driver’s licenses—and sometimes proof of address or source of funds. The goal is to establish user legitimacy before allowing significant trading or withdrawal activities. The depth and complexity of these processes can vary widely depending on regulatory requirements and internal risk assessments.
How Does Binance Implement Its KYC Procedures?
Binance's approach to KYC reflects both global compliance standards and its own operational policies. It employs a tiered verification system that allows users to access different levels of service based on their verification status:
- Level 1 (Basic Verification): Users provide minimal information such as email address or phone number.
- Level 2: Requires submission of government-issued ID documents like passports or driver’s licenses.
- Level 3: May involve additional steps such as facial recognition scans or proof of residence documents.
This layered approach aims to balance user convenience with security needs while adhering to AML/CFT regulations across various regions.
Documentation Requirements
For higher verification tiers—particularly Level 2—users must upload clear images or scans of official identification documents. Some regions may also require proof-of-address documentation like utility bills or bank statements. These measures help ensure that each account corresponds to a real individual with verifiable credentials.
Data Security Measures
Given concerns over privacy breaches in digital platforms today, Binance emphasizes strong data security practices during its KYC process. Personal data collected is stored securely following applicable data protection laws such as GDPR in Europe or similar frameworks elsewhere.
Recent Regulatory Developments Impacting Binance's KYC Policies
Binance has faced increased scrutiny from regulators worldwide in recent years—a trend that directly influences how strict its KYC processes are designed:
European Union Investigation (2023): The EU's Financial Intelligence Unit launched an inquiry into whether Binance complies with AML/CFT regulations within member states. This investigation underscores the importance placed on thorough customer verification.
US Senate Hearings (2024): Lawmakers questioned Binance's CEO about transparency around customer data handling and adherence to U.S.-specific regulations like FinCEN guidelines. Concerns raised during these hearings highlight potential vulnerabilities if compliance isn't maintained at high standards.
These developments suggest that regulatory bodies are pushing exchanges toward more rigorous identity checks while also demanding greater transparency regarding data privacy practices.
User Feedback: Balancing Security With Convenience
While many appreciate the enhanced security offered by strict KYC protocols—especially amid rising concerns over hacking incidents—others find these procedures burdensome:
- Some users report long wait times during document verification stages.
- Uploading high-quality images can be frustrating due to technical issues.
- Privacy-conscious individuals worry about how their personal information might be used or stored beyond regulatory requirements.
Such feedback indicates a tension between maintaining robust anti-fraud measures and providing seamless user experiences—a challenge faced by all major crypto platforms today.
Potential Impacts Of Stringent vs Lenient KYC Policies
The level of strictness in Binance's KYC process has tangible effects on both platform security and user engagement:
Positive Outcomes
- Improved prevention against illicit activities enhances overall platform integrity.
- Regulatory compliance reduces legal risks—including fines—and supports long-term operational stability.
- Transparent processes foster greater trust among compliant users who value safety assurances.
Challenges
- Overly complex procedures may deter new users from onboarding quickly.
- Excessive data collection raises privacy concerns; mishandling could lead to reputational damage if breaches occur.
- High operational costs associated with extensive identity checks might impact profitability margins over time.
Striking an optimal balance remains critical; too lenient approaches risk legal penalties while overly aggressive policies could hinder growth through user dissatisfaction.
How Does Binances’ Approach Compare With Industry Standards?
Compared globally, Binance’s tiered verification model aligns well with industry norms seen across leading exchanges such as Coinbase or Kraken—which also implement multi-level identity checks based on transaction volume thresholds or regional regulations. However,
some competitors have adopted even stricter measures post-regulatory pressure—for example,
requiring biometric authentication at every login stage—to further tighten security but potentially at the expense of convenience.
Binance continues evolving its policies amidst ongoing regulatory pressures; recent investigations suggest it may need further tightening depending on jurisdictional demands.
Final Thoughts: Is Binances’ KYC Process Too Strict?
Assessing whether Binance's current approach is excessively stringent depends largely on perspective:
From a regulator’s standpoint, rigorous identity verification aligns with global AML/CFT standards necessary for combating financial crimes effectively within decentralized finance environments where anonymity can be exploited maliciously.
From a user's perspective, some may find certain steps cumbersome but generally necessary given increasing cybersecurity threats today.
Overall,
Binance appears committed to maintaining high compliance levels through layered verification systems tailored per region—all while balancing usability challenges posed by evolving regulations.
By continuously refining its processes based on feedback from authorities and customers alike,
the exchange aims not only at meeting legal obligations but also fostering trustworthiness essential for sustainable growth in an increasingly regulated industry landscape.
This comprehensive overview highlights just how nuanced—and crucial—the question about “how strict” binance's kyc process truly is becomes when considering global regulation trends alongside user experience considerations.. Understanding this balance helps stakeholders navigate future developments confidently amid ongoing changes shaping cryptocurrency compliance standards worldwide
JCUSER-F1IIaxXA
2025-05-26 15:22
How strict is Binance’s KYC process?
How Strict Is Binance’s KYC Process?
Understanding the level of strictness in Binance’s Know Your Customer (KYC) procedures is essential for users, regulators, and industry observers alike. As one of the world’s largest cryptocurrency exchanges, Binance operates within a complex regulatory landscape that demands rigorous compliance measures. This article explores how stringent Binance’s KYC process is, what it entails, recent developments influencing its policies, and the implications for users and the platform itself.
What Does KYC Mean for Cryptocurrency Exchanges?
KYC stands for "Know Your Customer," a fundamental component of financial regulation designed to verify customer identities. For crypto exchanges like Binance, implementing effective KYC protocols helps prevent illegal activities such as money laundering, terrorist financing, and fraud. These procedures are mandated by international standards set by organizations like the Financial Action Task Force (FATF) and are enforced differently across jurisdictions.
In practice, KYC involves collecting personal identification documents—passports, driver’s licenses—and sometimes proof of address or source of funds. The goal is to establish user legitimacy before allowing significant trading or withdrawal activities. The depth and complexity of these processes can vary widely depending on regulatory requirements and internal risk assessments.
How Does Binance Implement Its KYC Procedures?
Binance's approach to KYC reflects both global compliance standards and its own operational policies. It employs a tiered verification system that allows users to access different levels of service based on their verification status:
- Level 1 (Basic Verification): Users provide minimal information such as email address or phone number.
- Level 2: Requires submission of government-issued ID documents like passports or driver’s licenses.
- Level 3: May involve additional steps such as facial recognition scans or proof of residence documents.
This layered approach aims to balance user convenience with security needs while adhering to AML/CFT regulations across various regions.
Documentation Requirements
For higher verification tiers—particularly Level 2—users must upload clear images or scans of official identification documents. Some regions may also require proof-of-address documentation like utility bills or bank statements. These measures help ensure that each account corresponds to a real individual with verifiable credentials.
Data Security Measures
Given concerns over privacy breaches in digital platforms today, Binance emphasizes strong data security practices during its KYC process. Personal data collected is stored securely following applicable data protection laws such as GDPR in Europe or similar frameworks elsewhere.
Recent Regulatory Developments Impacting Binance's KYC Policies
Binance has faced increased scrutiny from regulators worldwide in recent years—a trend that directly influences how strict its KYC processes are designed:
European Union Investigation (2023): The EU's Financial Intelligence Unit launched an inquiry into whether Binance complies with AML/CFT regulations within member states. This investigation underscores the importance placed on thorough customer verification.
US Senate Hearings (2024): Lawmakers questioned Binance's CEO about transparency around customer data handling and adherence to U.S.-specific regulations like FinCEN guidelines. Concerns raised during these hearings highlight potential vulnerabilities if compliance isn't maintained at high standards.
These developments suggest that regulatory bodies are pushing exchanges toward more rigorous identity checks while also demanding greater transparency regarding data privacy practices.
User Feedback: Balancing Security With Convenience
While many appreciate the enhanced security offered by strict KYC protocols—especially amid rising concerns over hacking incidents—others find these procedures burdensome:
- Some users report long wait times during document verification stages.
- Uploading high-quality images can be frustrating due to technical issues.
- Privacy-conscious individuals worry about how their personal information might be used or stored beyond regulatory requirements.
Such feedback indicates a tension between maintaining robust anti-fraud measures and providing seamless user experiences—a challenge faced by all major crypto platforms today.
Potential Impacts Of Stringent vs Lenient KYC Policies
The level of strictness in Binance's KYC process has tangible effects on both platform security and user engagement:
Positive Outcomes
- Improved prevention against illicit activities enhances overall platform integrity.
- Regulatory compliance reduces legal risks—including fines—and supports long-term operational stability.
- Transparent processes foster greater trust among compliant users who value safety assurances.
Challenges
- Overly complex procedures may deter new users from onboarding quickly.
- Excessive data collection raises privacy concerns; mishandling could lead to reputational damage if breaches occur.
- High operational costs associated with extensive identity checks might impact profitability margins over time.
Striking an optimal balance remains critical; too lenient approaches risk legal penalties while overly aggressive policies could hinder growth through user dissatisfaction.
How Does Binances’ Approach Compare With Industry Standards?
Compared globally, Binance’s tiered verification model aligns well with industry norms seen across leading exchanges such as Coinbase or Kraken—which also implement multi-level identity checks based on transaction volume thresholds or regional regulations. However,
some competitors have adopted even stricter measures post-regulatory pressure—for example,
requiring biometric authentication at every login stage—to further tighten security but potentially at the expense of convenience.
Binance continues evolving its policies amidst ongoing regulatory pressures; recent investigations suggest it may need further tightening depending on jurisdictional demands.
Final Thoughts: Is Binances’ KYC Process Too Strict?
Assessing whether Binance's current approach is excessively stringent depends largely on perspective:
From a regulator’s standpoint, rigorous identity verification aligns with global AML/CFT standards necessary for combating financial crimes effectively within decentralized finance environments where anonymity can be exploited maliciously.
From a user's perspective, some may find certain steps cumbersome but generally necessary given increasing cybersecurity threats today.
Overall,
Binance appears committed to maintaining high compliance levels through layered verification systems tailored per region—all while balancing usability challenges posed by evolving regulations.
By continuously refining its processes based on feedback from authorities and customers alike,
the exchange aims not only at meeting legal obligations but also fostering trustworthiness essential for sustainable growth in an increasingly regulated industry landscape.
This comprehensive overview highlights just how nuanced—and crucial—the question about “how strict” binance's kyc process truly is becomes when considering global regulation trends alongside user experience considerations.. Understanding this balance helps stakeholders navigate future developments confidently amid ongoing changes shaping cryptocurrency compliance standards worldwide
Disclaimer:Contains third-party content. Not financial advice.
See Terms and Conditions.
How Do Platforms Secure Cold Wallets?
Understanding Cold Wallet Security in Cryptocurrency
Cold wallets, also known as hardware wallets, are essential tools for safeguarding digital assets. Unlike hot wallets, which are connected to the internet and more vulnerable to cyber threats, cold wallets store private keys offline. This offline storage significantly reduces the risk of hacking, phishing attacks, and unauthorized access. As cryptocurrencies gain mainstream adoption among individual investors and institutions alike, securing these assets has become a top priority for platforms managing digital holdings.
Platforms that facilitate cryptocurrency transactions or custody services employ multiple strategies to enhance cold wallet security. These measures aim to protect private keys from physical theft, software vulnerabilities, and operational errors while ensuring compliance with regulatory standards.
Physical Security Measures
One of the fundamental aspects of securing cold wallets involves physical security protocols. Since these devices are tangible objects—such as Ledger Nano X or Trezor Model T—they can be physically stolen or lost if not properly secured. Platforms typically implement strict access controls within their facilities:
- Secure Storage Facilities: Cold wallets are stored in secure vaults with biometric access controls.
- Restricted Access: Only authorized personnel have physical access to storage areas containing hardware devices.
- Secure Transportation: When transferring cold wallets between locations or during maintenance procedures, platforms use tamper-evident packaging and secure courier services.
Additionally, many organizations enforce dual-control policies where two or more trusted individuals must authorize any movement or handling of hardware devices.
Encryption and Firmware Security
Beyond physical safeguards, platforms prioritize encryption at every stage of wallet management:
- Encrypted Storage: Private keys stored on cold wallets are protected by robust encryption algorithms both on the device itself and during any data transfer processes.
- Firmware Integrity Checks: Regular firmware updates from manufacturers like Ledger or Trezor include security patches that address known vulnerabilities. Platforms verify firmware authenticity through cryptographic signatures before installation.
- Secure Boot Processes: Hardware devices utilize secure boot mechanisms that prevent unauthorized firmware modifications—ensuring only validated software runs on the device.
Manufacturers often provide detailed documentation about their security architecture; platforms leverage this information to maintain high-security standards when deploying cold wallets at scale.
Multi-Factor Authentication (MFA) & Multi-Signature Support
To further bolster security during transaction authorization:
Multi-Signature Transactions: Many platforms configure their systems so that multiple private keys (stored across different hardware devices) must sign off on a transaction before it is executed. This multi-signature approach mitigates risks associated with single-point failures.
For example:
- A platform might require signatures from three separate hardware wallets held in different locations before releasing funds.
Biometric Authentication & PIN Codes: Some modern cold wallet models incorporate biometric verification (fingerprint scans) alongside PIN codes for accessing device functions—adding an extra layer against unauthorized use.
Operational Procedures & Staff Training
Effective cybersecurity extends beyond technology; human factors play a crucial role:
Staff Training: Employees handling cold wallet operations undergo rigorous training on best practices—such as recognizing phishing attempts targeting staff members who manage asset storage.
Procedural Controls: Clear protocols govern how new hardware is initialized, how backups are created securely (e.g., seed phrases stored offline), and how recovery processes operate if a device is lost or damaged.
Regular audits ensure adherence to these procedures while minimizing operational risks associated with human error.
Regulatory Compliance & Industry Standards
As regulatory frameworks evolve globally around digital assets:
Platforms increasingly align their security practices with industry standards such as ISO/IEC 27001 for information security management systems (ISMS).
Some providers seek certifications demonstrating compliance with financial regulations like AML/KYC requirements—which indirectly enhance overall asset protection by enforcing strict identity verification processes during onboarding and transactions involving cold storage solutions.
Advanced Technologies Enhancing Cold Wallet Security
Emerging innovations continue shaping how platforms safeguard these critical assets:
- Biometric Authentication: Incorporating fingerprint scanners or facial recognition into hardware devices enhances user verification processes directly at the point of access.
- Multi-Factor Authentication: Combining something users know (PIN), something they have (hardware wallet), and something they are (biometrics) creates layered defenses against theft.
- Tamper-Evident Packaging: During shipping or transfer phases, tamper-evident seals alert custodians if a device has been compromised en route.
- Blockchain-Based Access Control: Some advanced systems utilize blockchain technology itself to manage permissions dynamically across multiple stakeholders securely.
Risks Still Present Despite Robust Measures
While platform-level strategies significantly improve safety margins for cold wallet management—such as encrypted data transmission and multi-signature setups—the inherent risks cannot be entirely eliminated:
• Physical Loss: Devices can be misplaced or stolen unless stored securely in controlled environments.• Phishing Attacks: Users may still fall victim if they inadvertently disclose seed phrases via malicious websites posing as legitimate service providers.• Software Vulnerabilities: Although rare due to rigorous testing by manufacturers like Ledger Labs or SatoshiLabs (Trezor), firmware bugs could potentially expose private keys if not promptly patched.
Final Thoughts on Securing Cold Wallets in Cryptocurrency Platforms
Cryptocurrency platforms invest heavily in layered defense mechanisms—from physical safeguards like vaults and tamper-proof packaging to sophisticated encryption protocols—to protect users’ digital assets stored offline via cold wallets. The integration of multi-signature support combined with advanced authentication methods ensures that even internal threats pose minimal risk when managed correctly under strict operational procedures aligned with industry standards.
However—and this remains critical—the human element cannot be overlooked; ongoing staff training coupled with vigilant operational oversight is essential for maintaining high-security levels over time. As technological advancements continue—for instance biometric integrations—the landscape will likely see further enhancements aimed at making crypto custody safer than ever before while balancing ease-of-use versus maximum protection needs.
Keywords: cryptocurrency security measures | protecting crypto assets | hardware wallet safety | multi-signature crypto transactions | institutional crypto custody | blockchain security technologies

Lo
2025-05-26 15:06
How do platforms secure cold wallets?
How Do Platforms Secure Cold Wallets?
Understanding Cold Wallet Security in Cryptocurrency
Cold wallets, also known as hardware wallets, are essential tools for safeguarding digital assets. Unlike hot wallets, which are connected to the internet and more vulnerable to cyber threats, cold wallets store private keys offline. This offline storage significantly reduces the risk of hacking, phishing attacks, and unauthorized access. As cryptocurrencies gain mainstream adoption among individual investors and institutions alike, securing these assets has become a top priority for platforms managing digital holdings.
Platforms that facilitate cryptocurrency transactions or custody services employ multiple strategies to enhance cold wallet security. These measures aim to protect private keys from physical theft, software vulnerabilities, and operational errors while ensuring compliance with regulatory standards.
Physical Security Measures
One of the fundamental aspects of securing cold wallets involves physical security protocols. Since these devices are tangible objects—such as Ledger Nano X or Trezor Model T—they can be physically stolen or lost if not properly secured. Platforms typically implement strict access controls within their facilities:
- Secure Storage Facilities: Cold wallets are stored in secure vaults with biometric access controls.
- Restricted Access: Only authorized personnel have physical access to storage areas containing hardware devices.
- Secure Transportation: When transferring cold wallets between locations or during maintenance procedures, platforms use tamper-evident packaging and secure courier services.
Additionally, many organizations enforce dual-control policies where two or more trusted individuals must authorize any movement or handling of hardware devices.
Encryption and Firmware Security
Beyond physical safeguards, platforms prioritize encryption at every stage of wallet management:
- Encrypted Storage: Private keys stored on cold wallets are protected by robust encryption algorithms both on the device itself and during any data transfer processes.
- Firmware Integrity Checks: Regular firmware updates from manufacturers like Ledger or Trezor include security patches that address known vulnerabilities. Platforms verify firmware authenticity through cryptographic signatures before installation.
- Secure Boot Processes: Hardware devices utilize secure boot mechanisms that prevent unauthorized firmware modifications—ensuring only validated software runs on the device.
Manufacturers often provide detailed documentation about their security architecture; platforms leverage this information to maintain high-security standards when deploying cold wallets at scale.
Multi-Factor Authentication (MFA) & Multi-Signature Support
To further bolster security during transaction authorization:
Multi-Signature Transactions: Many platforms configure their systems so that multiple private keys (stored across different hardware devices) must sign off on a transaction before it is executed. This multi-signature approach mitigates risks associated with single-point failures.
For example:
- A platform might require signatures from three separate hardware wallets held in different locations before releasing funds.
Biometric Authentication & PIN Codes: Some modern cold wallet models incorporate biometric verification (fingerprint scans) alongside PIN codes for accessing device functions—adding an extra layer against unauthorized use.
Operational Procedures & Staff Training
Effective cybersecurity extends beyond technology; human factors play a crucial role:
Staff Training: Employees handling cold wallet operations undergo rigorous training on best practices—such as recognizing phishing attempts targeting staff members who manage asset storage.
Procedural Controls: Clear protocols govern how new hardware is initialized, how backups are created securely (e.g., seed phrases stored offline), and how recovery processes operate if a device is lost or damaged.
Regular audits ensure adherence to these procedures while minimizing operational risks associated with human error.
Regulatory Compliance & Industry Standards
As regulatory frameworks evolve globally around digital assets:
Platforms increasingly align their security practices with industry standards such as ISO/IEC 27001 for information security management systems (ISMS).
Some providers seek certifications demonstrating compliance with financial regulations like AML/KYC requirements—which indirectly enhance overall asset protection by enforcing strict identity verification processes during onboarding and transactions involving cold storage solutions.
Advanced Technologies Enhancing Cold Wallet Security
Emerging innovations continue shaping how platforms safeguard these critical assets:
- Biometric Authentication: Incorporating fingerprint scanners or facial recognition into hardware devices enhances user verification processes directly at the point of access.
- Multi-Factor Authentication: Combining something users know (PIN), something they have (hardware wallet), and something they are (biometrics) creates layered defenses against theft.
- Tamper-Evident Packaging: During shipping or transfer phases, tamper-evident seals alert custodians if a device has been compromised en route.
- Blockchain-Based Access Control: Some advanced systems utilize blockchain technology itself to manage permissions dynamically across multiple stakeholders securely.
Risks Still Present Despite Robust Measures
While platform-level strategies significantly improve safety margins for cold wallet management—such as encrypted data transmission and multi-signature setups—the inherent risks cannot be entirely eliminated:
• Physical Loss: Devices can be misplaced or stolen unless stored securely in controlled environments.• Phishing Attacks: Users may still fall victim if they inadvertently disclose seed phrases via malicious websites posing as legitimate service providers.• Software Vulnerabilities: Although rare due to rigorous testing by manufacturers like Ledger Labs or SatoshiLabs (Trezor), firmware bugs could potentially expose private keys if not promptly patched.
Final Thoughts on Securing Cold Wallets in Cryptocurrency Platforms
Cryptocurrency platforms invest heavily in layered defense mechanisms—from physical safeguards like vaults and tamper-proof packaging to sophisticated encryption protocols—to protect users’ digital assets stored offline via cold wallets. The integration of multi-signature support combined with advanced authentication methods ensures that even internal threats pose minimal risk when managed correctly under strict operational procedures aligned with industry standards.
However—and this remains critical—the human element cannot be overlooked; ongoing staff training coupled with vigilant operational oversight is essential for maintaining high-security levels over time. As technological advancements continue—for instance biometric integrations—the landscape will likely see further enhancements aimed at making crypto custody safer than ever before while balancing ease-of-use versus maximum protection needs.
Keywords: cryptocurrency security measures | protecting crypto assets | hardware wallet safety | multi-signature crypto transactions | institutional crypto custody | blockchain security technologies
Disclaimer:Contains third-party content. Not financial advice.
See Terms and Conditions.
What is the Chikou Span? A Complete Explanation
Understanding technical analysis tools is essential for traders and investors aiming to make informed decisions. Among these tools, the Ichimoku Cloud stands out for its comprehensive approach to market analysis, with the Chikou Span being a vital component. This article provides an in-depth look at what the Chikou Span is, how it functions within the Ichimoku system, and its relevance in both stock and cryptocurrency markets.
The Role of the Chikou Span in Technical Analysis
The Chikou Span, often called the Lagging Span, serves as a confirmation tool within the Ichimoku Cloud framework. Its primary purpose is to help traders identify trend direction and potential reversals by comparing current prices with past prices. Unlike leading indicators that predict future movements or oscillators that measure momentum, lagging indicators like the Chikou Span analyze historical data to validate current trends.
In practice, this means plotting a security’s closing price 26 periods behind its current position. If this lagging line remains above previous prices over time, it suggests sustained upward momentum; if below, it indicates downward pressure. When combined with other components of the Ichimoku system—such as Tenkan-sen (Conversion Line) or Kijun-sen (Base Line)—the Chikou Span enhances overall market insight.
How Is The Chikou Span Calculated?
The calculation of the Chikou Span is straightforward but crucial for accurate interpretation. It involves taking today's closing price and plotting it 26 periods back on your chart. For example:
- If today’s closing price is $100,
- You would plot $100 on your chart 26 days ago (or 26 candlesticks if using daily data).
This simple shift creates a visual representation that allows traders to compare past prices directly with current levels without complex formulas or additional calculations.
Interpreting The Chikou Span: What Do Different Positions Mean?
The position of the Chikou Span relative to past prices offers valuable insights into market sentiment:
- Above previous prices: Indicates bullish momentum; recent closes are higher than those from 26 periods ago.
- Below previous prices: Signals bearish sentiment; recent closes are lower than those from 26 periods ago.
- Crossing over: When this line crosses above or below historical price levels—especially when combined with other signals—it can suggest potential trend reversals.
For example:
- A rising Chikou span crossing above past prices may confirm an emerging uptrend.
- Conversely, crossing below could warn of a downtrend forming.
Traders often look for these crossovers as part of their decision-making process alongside other elements like cloud support/resistance levels.
Historical Background and Development
The Ichimoku Cloud was developed by Japanese journalist Goichi Hosoda during the late 1960s as an all-in-one trading system designed for quick decision-making without relying on multiple separate indicators. Its name translates roughly as "one glance" cloud because it provides a comprehensive view at a glance through five key components—including Tenkan-sen, Kijun-sen, Senkou Spans A & B (Leading Spans), and notably—the Chikou Span.
Since its inception decades ago, this method has gained worldwide popularity among professional traders due to its ability to depict trend strength and potential reversal points effectively across various markets—from stocks to forex and cryptocurrencies.
Practical Applications in Stock Trading
In stock markets today, many traders incorporate Ichimoku components—including the Chikoudo span—to enhance their technical analysis toolkit. It helps identify long-term trends by confirming whether recent price action aligns with historical movement patterns captured by lagging lines like Chiukō span.
For instance:
- When stock prices are above all cloud boundaries AND Chiukō spans remain above past lows—this typically signals strong bullish conditions.
- Conversely,if stock prices fall below key support levels while Chiukō spans stay beneath prior lows—it suggests bearish dominance or possible trend exhaustion.
Using these signals together improves confidence in trade entries/exits while reducing false positives common when relying solely on single indicators.
Application in Cryptocurrency Markets
Cryptocurrency trading has seen rapid growth over recent years—with high volatility making reliable analysis essential. Traders have adapted traditional tools like Ichimoku Cloud because they provide clear visual cues amidst turbulent price swings typical of digital assets such as Bitcoin or Ethereum.
In crypto markets:
- The Lagging span can help confirm whether recent surges are sustainable.
- Crossings between Chiukō spans and historical lows/highs serve as early warning signs for reversals amid volatile conditions.
However—as cryptocurrencies tend toward extreme volatility—the effectiveness of lagging indicators like Chiukō should be complemented with volume analysis or other momentum tools for better accuracy.
Limitations To Keep In Mind
While useful—like any indicator—theChikuo span isn’t perfect:
- Lag Effect: Since it's based on past data (26 periods behind), it may not react quickly enough during sudden market moves.
- False Signals: In highly volatile environments such as crypto markets or during news events—crossovers might generate misleading signals.
- Market Conditions: During sideways consolidation phases—or choppy ranges—the indicator's readings can become ambiguous.
Therefore—and especially when trading high-volatility assets—it’s advisable always to combine Lagging Spans with other technical tools such as volume profiles or oscillators like RSI/MACD.
How To Use The Chikou Spread Effectively
To maximize utility:
- Confirm trend direction via position relative to prior candles
- Watch for crossovers indicating possible reversals
- Use alongside cloud support/resistance zones
- Combine with volume confirmation where applicable
By integrating these strategies into your trading plan—and understanding both strengths & limitations—you’ll improve your chances of making more accurate predictions about future market movements.
Final Thoughts on The Importance Of The Lagging Indicator
TheChikuo span remains an integral part of modern technical analysis due primarily to its simplicity yet powerful confirmation capabilities within broader systems likeIchimoku Cloud . Whether you're analyzing stocks or cryptocurrencies , understanding how this indicator works will enhance your abilityto interpret long-term trends accurately .
While no single tool guarantees success — combiningLagging Spanswith other analytical methods will give you more robust insights into market dynamics . As always — continuous learningand practical experienceare key ingredientsfor successful trading.
Note: Always remember that no indicator should be used in isolation; effective risk management practices remain essential regardlessof which analytical techniques you employ.
kai
2025-05-20 03:02
What’s Chikou Span?
What is the Chikou Span? A Complete Explanation
Understanding technical analysis tools is essential for traders and investors aiming to make informed decisions. Among these tools, the Ichimoku Cloud stands out for its comprehensive approach to market analysis, with the Chikou Span being a vital component. This article provides an in-depth look at what the Chikou Span is, how it functions within the Ichimoku system, and its relevance in both stock and cryptocurrency markets.
The Role of the Chikou Span in Technical Analysis
The Chikou Span, often called the Lagging Span, serves as a confirmation tool within the Ichimoku Cloud framework. Its primary purpose is to help traders identify trend direction and potential reversals by comparing current prices with past prices. Unlike leading indicators that predict future movements or oscillators that measure momentum, lagging indicators like the Chikou Span analyze historical data to validate current trends.
In practice, this means plotting a security’s closing price 26 periods behind its current position. If this lagging line remains above previous prices over time, it suggests sustained upward momentum; if below, it indicates downward pressure. When combined with other components of the Ichimoku system—such as Tenkan-sen (Conversion Line) or Kijun-sen (Base Line)—the Chikou Span enhances overall market insight.
How Is The Chikou Span Calculated?
The calculation of the Chikou Span is straightforward but crucial for accurate interpretation. It involves taking today's closing price and plotting it 26 periods back on your chart. For example:
- If today’s closing price is $100,
- You would plot $100 on your chart 26 days ago (or 26 candlesticks if using daily data).
This simple shift creates a visual representation that allows traders to compare past prices directly with current levels without complex formulas or additional calculations.
Interpreting The Chikou Span: What Do Different Positions Mean?
The position of the Chikou Span relative to past prices offers valuable insights into market sentiment:
- Above previous prices: Indicates bullish momentum; recent closes are higher than those from 26 periods ago.
- Below previous prices: Signals bearish sentiment; recent closes are lower than those from 26 periods ago.
- Crossing over: When this line crosses above or below historical price levels—especially when combined with other signals—it can suggest potential trend reversals.
For example:
- A rising Chikou span crossing above past prices may confirm an emerging uptrend.
- Conversely, crossing below could warn of a downtrend forming.
Traders often look for these crossovers as part of their decision-making process alongside other elements like cloud support/resistance levels.
Historical Background and Development
The Ichimoku Cloud was developed by Japanese journalist Goichi Hosoda during the late 1960s as an all-in-one trading system designed for quick decision-making without relying on multiple separate indicators. Its name translates roughly as "one glance" cloud because it provides a comprehensive view at a glance through five key components—including Tenkan-sen, Kijun-sen, Senkou Spans A & B (Leading Spans), and notably—the Chikou Span.
Since its inception decades ago, this method has gained worldwide popularity among professional traders due to its ability to depict trend strength and potential reversal points effectively across various markets—from stocks to forex and cryptocurrencies.
Practical Applications in Stock Trading
In stock markets today, many traders incorporate Ichimoku components—including the Chikoudo span—to enhance their technical analysis toolkit. It helps identify long-term trends by confirming whether recent price action aligns with historical movement patterns captured by lagging lines like Chiukō span.
For instance:
- When stock prices are above all cloud boundaries AND Chiukō spans remain above past lows—this typically signals strong bullish conditions.
- Conversely,if stock prices fall below key support levels while Chiukō spans stay beneath prior lows—it suggests bearish dominance or possible trend exhaustion.
Using these signals together improves confidence in trade entries/exits while reducing false positives common when relying solely on single indicators.
Application in Cryptocurrency Markets
Cryptocurrency trading has seen rapid growth over recent years—with high volatility making reliable analysis essential. Traders have adapted traditional tools like Ichimoku Cloud because they provide clear visual cues amidst turbulent price swings typical of digital assets such as Bitcoin or Ethereum.
In crypto markets:
- The Lagging span can help confirm whether recent surges are sustainable.
- Crossings between Chiukō spans and historical lows/highs serve as early warning signs for reversals amid volatile conditions.
However—as cryptocurrencies tend toward extreme volatility—the effectiveness of lagging indicators like Chiukō should be complemented with volume analysis or other momentum tools for better accuracy.
Limitations To Keep In Mind
While useful—like any indicator—theChikuo span isn’t perfect:
- Lag Effect: Since it's based on past data (26 periods behind), it may not react quickly enough during sudden market moves.
- False Signals: In highly volatile environments such as crypto markets or during news events—crossovers might generate misleading signals.
- Market Conditions: During sideways consolidation phases—or choppy ranges—the indicator's readings can become ambiguous.
Therefore—and especially when trading high-volatility assets—it’s advisable always to combine Lagging Spans with other technical tools such as volume profiles or oscillators like RSI/MACD.
How To Use The Chikou Spread Effectively
To maximize utility:
- Confirm trend direction via position relative to prior candles
- Watch for crossovers indicating possible reversals
- Use alongside cloud support/resistance zones
- Combine with volume confirmation where applicable
By integrating these strategies into your trading plan—and understanding both strengths & limitations—you’ll improve your chances of making more accurate predictions about future market movements.
Final Thoughts on The Importance Of The Lagging Indicator
TheChikuo span remains an integral part of modern technical analysis due primarily to its simplicity yet powerful confirmation capabilities within broader systems likeIchimoku Cloud . Whether you're analyzing stocks or cryptocurrencies , understanding how this indicator works will enhance your abilityto interpret long-term trends accurately .
While no single tool guarantees success — combiningLagging Spanswith other analytical methods will give you more robust insights into market dynamics . As always — continuous learningand practical experienceare key ingredientsfor successful trading.
Note: Always remember that no indicator should be used in isolation; effective risk management practices remain essential regardlessof which analytical techniques you employ.
Disclaimer:Contains third-party content. Not financial advice.
See Terms and Conditions.
What Is a Chart Legend and Why Is It Important?
A chart legend, also known as a key, is an essential component of data visualization that helps viewers interpret the information presented. It acts as a guide, explaining what each symbol, color, or line in the chart represents. Without a clear legend, understanding complex charts—especially those used in crypto trading and investment analysis—becomes challenging. For investors and analysts alike, accurate interpretation of these visual tools is critical for making informed decisions.
In financial markets like cryptocurrencies and stocks, data can be dense and multifaceted. Charts often display multiple metrics simultaneously—such as price trends, trading volume, moving averages, or market capitalization—all using different colors or symbols. The legend clarifies these elements so users can quickly grasp which line indicates price movement versus volume or which color corresponds to specific timeframes.
The primary purpose of a chart legend is to provide clarity. It ensures that every visual element on the chart has an associated explanation that makes sense to both novice traders and seasoned investors. This transparency reduces misinterpretation risks—a vital factor when market decisions depend on precise data analysis.
Types of Chart Legends Used in Financial Charts
Chart legends come in various formats depending on the complexity of the visualization and user preferences. The most common types include:
- Inside Legends: Positioned within the boundaries of the chart itself; suitable for smaller charts where space is limited.
- Outside Legends: Located outside the main plotting area; more common with larger or more detailed charts because they prevent cluttering.
- Floating Legends: These are movable overlays that users can position anywhere around or within their charts for optimal visibility.
Components Typically Found in a Chart Legend
A standard chart legend usually comprises three main elements:
- Symbols: Visual markers such as lines (for trend lines), bars (for volume), dots (for specific data points), etc., representing different datasets.
- Colors: Used to differentiate between various metrics—for example, green for upward price movements and red for declines.
- Labels: Text descriptions accompanying each symbol/color combination explaining what it signifies—like "Price," "Volume," "Moving Average 50-day."
These components work together to create an intuitive guide that enhances comprehension without overwhelming viewers with excessive details.
Why Accurate Legends Matter in Crypto & Investment Charts
In volatile markets like cryptocurrencies where prices fluctuate rapidly within short periods, clear visualization becomes even more crucial. Investors rely heavily on technical analysis tools displayed through multiple overlapping lines and indicators; thus, understanding what each element represents directly impacts decision-making quality.
An effective legend helps distinguish between different types of data: whether it's identifying support/resistance levels via trendlines or interpreting trading volumes alongside price movements. Misreading these visuals due to unclear legends could lead traders into making costly mistakes—buying at peaks or selling during dips based on misinterpreted signals.
Recent Innovations Enhancing Chart Legends
Advancements in technology have transformed how legends function within financial charts:
Interactive Legends: Platforms like TradingView allow users to hover over symbols for instant details about specific datasets without cluttering the visual space with static labels.
Customization Options: Modern tools such as Google Charts enable users to modify font styles, colors, positions—and even toggle visibility—to tailor their charts according to personal preferences or presentation needs.
AI-Powered Legend Generation: Emerging solutions leverage artificial intelligence algorithms capable of automatically creating accurate legends based on real-time data inputs—saving time while maintaining precision.
These innovations improve user experience by making complex information more accessible while reducing cognitive load during analysis sessions.
Potential Challenges with Chart Legends
Despite technological progressions, some issues persist:
Overly complicated legends can overwhelm viewers rather than clarify information—they may contain too many symbols or confusing layouts leading to misunderstandings.
Technical glitches might impair interactive features; if an interactive legend fails due to software bugs or connectivity issues—which occasionally happens—it hampers quick interpretation efforts.
Inconsistent placement across platforms may cause confusion among users accustomed to certain layouts; standardization remains important but isn't always maintained across different tools.
Investors should ensure they understand how their chosen platform handles legends so they can interpret charts accurately under varying conditions.
How To Optimize Your Use Of Chart Legends
To maximize clarity when analyzing crypto investment graphs:
- Choose platforms offering customizable legends suited for your analytical style.
- Pay attention during initial setup by verifying labels match your intended metrics before relying solely on visual cues.
- Use interactive features when available—they provide additional context without cluttering your view.
- Keep track of color schemes used across different charts since inconsistent coloring conventions could lead to confusion over time.
Understanding Data Visualization Best Practices
Effective use of chart legends aligns with broader principles of good data visualization practices:
- Keep labels concise yet descriptive enough for quick comprehension
- Avoid overcrowding by limiting unnecessary symbols
- Maintain consistent formatting throughout your analyses
- Test readability across devices if you frequently switch between desktops and mobile devices
By adhering these standards—and leveraging modern customization options—you enhance both accuracy and efficiency when interpreting financial data visually.
The Role Of Legible & Well-Placed Legacies In Financial Analysis
Clear legibility isn’t just about aesthetics—it’s fundamental for accurate decision-making:
- Proper placement ensures key insights aren’t hidden behind other elements
- Readable fonts prevent misreading critical figures
- Adequate contrast between text/colors improves accessibility
Investors should prioritize well-designed legends tailored specifically toward their analytical needs rather than generic templates.
Future Trends In Chart Legend Design And Functionality
Looking ahead at developments shaping how we interpret financial visuals:
- Enhanced interactivity will become standard—allowing deeper dives into datasets via hover-over tooltips
- AI-driven customization will enable automatic adjustments based on user behavior patterns
- Integration with voice commands might allow verbal queries about specific dataset components during live analysis sessions
Such innovations aim not only at improving usability but also at empowering investors through smarter insights extraction from complex market data.
Risks Associated With Poorly Designed Or Misused Legends
Misinterpretation stemming from inadequate labeling poses significant risks:
- Making trades based on misunderstood signals could result in substantial losses
- Overcomplicated legends may deter thorough analysis altogether
- Technical failures might leave traders blindfolded during critical moments
Therefore—as part of responsible investing—it’s essential always to verify that your chart’s legend accurately reflects its contents before acting upon any visualized information.
Enhancing Your Data Interpretation Skills Through Better Visuals
Investors aiming for better outcomes should focus not only on collecting high-quality data but also mastering how it’s visually represented:
- Regularly familiarize yourself with common symbols used across platforms
- Practice reading various types of graphs—including candlestick patterns,volume histograms,moving averages,trendlines,indicators like RSI & MACD
This ongoing education improves confidence while reducing reliance solely on raw numbers—a key step toward becoming proficient at technical analysis.
Summary
A well-crafted chart legend plays a pivotal role in translating complex financial visuals into actionable insights — especially vital within fast-moving markets such as cryptocurrency trading where rapid interpretation influences success rates significantly . Advances like interactive features and AI-generated explanations continue enhancing this aspect further but require careful implementation lest they introduce new challenges such as complexity overloads or technical issues . By understanding its purpose—and applying best practices—you empower yourself with clearer perspectives needed for confident investment decisions.
Lo
2025-05-19 18:22
What's a chart legend?
What Is a Chart Legend and Why Is It Important?
A chart legend, also known as a key, is an essential component of data visualization that helps viewers interpret the information presented. It acts as a guide, explaining what each symbol, color, or line in the chart represents. Without a clear legend, understanding complex charts—especially those used in crypto trading and investment analysis—becomes challenging. For investors and analysts alike, accurate interpretation of these visual tools is critical for making informed decisions.
In financial markets like cryptocurrencies and stocks, data can be dense and multifaceted. Charts often display multiple metrics simultaneously—such as price trends, trading volume, moving averages, or market capitalization—all using different colors or symbols. The legend clarifies these elements so users can quickly grasp which line indicates price movement versus volume or which color corresponds to specific timeframes.
The primary purpose of a chart legend is to provide clarity. It ensures that every visual element on the chart has an associated explanation that makes sense to both novice traders and seasoned investors. This transparency reduces misinterpretation risks—a vital factor when market decisions depend on precise data analysis.
Types of Chart Legends Used in Financial Charts
Chart legends come in various formats depending on the complexity of the visualization and user preferences. The most common types include:
- Inside Legends: Positioned within the boundaries of the chart itself; suitable for smaller charts where space is limited.
- Outside Legends: Located outside the main plotting area; more common with larger or more detailed charts because they prevent cluttering.
- Floating Legends: These are movable overlays that users can position anywhere around or within their charts for optimal visibility.
Components Typically Found in a Chart Legend
A standard chart legend usually comprises three main elements:
- Symbols: Visual markers such as lines (for trend lines), bars (for volume), dots (for specific data points), etc., representing different datasets.
- Colors: Used to differentiate between various metrics—for example, green for upward price movements and red for declines.
- Labels: Text descriptions accompanying each symbol/color combination explaining what it signifies—like "Price," "Volume," "Moving Average 50-day."
These components work together to create an intuitive guide that enhances comprehension without overwhelming viewers with excessive details.
Why Accurate Legends Matter in Crypto & Investment Charts
In volatile markets like cryptocurrencies where prices fluctuate rapidly within short periods, clear visualization becomes even more crucial. Investors rely heavily on technical analysis tools displayed through multiple overlapping lines and indicators; thus, understanding what each element represents directly impacts decision-making quality.
An effective legend helps distinguish between different types of data: whether it's identifying support/resistance levels via trendlines or interpreting trading volumes alongside price movements. Misreading these visuals due to unclear legends could lead traders into making costly mistakes—buying at peaks or selling during dips based on misinterpreted signals.
Recent Innovations Enhancing Chart Legends
Advancements in technology have transformed how legends function within financial charts:
Interactive Legends: Platforms like TradingView allow users to hover over symbols for instant details about specific datasets without cluttering the visual space with static labels.
Customization Options: Modern tools such as Google Charts enable users to modify font styles, colors, positions—and even toggle visibility—to tailor their charts according to personal preferences or presentation needs.
AI-Powered Legend Generation: Emerging solutions leverage artificial intelligence algorithms capable of automatically creating accurate legends based on real-time data inputs—saving time while maintaining precision.
These innovations improve user experience by making complex information more accessible while reducing cognitive load during analysis sessions.
Potential Challenges with Chart Legends
Despite technological progressions, some issues persist:
Overly complicated legends can overwhelm viewers rather than clarify information—they may contain too many symbols or confusing layouts leading to misunderstandings.
Technical glitches might impair interactive features; if an interactive legend fails due to software bugs or connectivity issues—which occasionally happens—it hampers quick interpretation efforts.
Inconsistent placement across platforms may cause confusion among users accustomed to certain layouts; standardization remains important but isn't always maintained across different tools.
Investors should ensure they understand how their chosen platform handles legends so they can interpret charts accurately under varying conditions.
How To Optimize Your Use Of Chart Legends
To maximize clarity when analyzing crypto investment graphs:
- Choose platforms offering customizable legends suited for your analytical style.
- Pay attention during initial setup by verifying labels match your intended metrics before relying solely on visual cues.
- Use interactive features when available—they provide additional context without cluttering your view.
- Keep track of color schemes used across different charts since inconsistent coloring conventions could lead to confusion over time.
Understanding Data Visualization Best Practices
Effective use of chart legends aligns with broader principles of good data visualization practices:
- Keep labels concise yet descriptive enough for quick comprehension
- Avoid overcrowding by limiting unnecessary symbols
- Maintain consistent formatting throughout your analyses
- Test readability across devices if you frequently switch between desktops and mobile devices
By adhering these standards—and leveraging modern customization options—you enhance both accuracy and efficiency when interpreting financial data visually.
The Role Of Legible & Well-Placed Legacies In Financial Analysis
Clear legibility isn’t just about aesthetics—it’s fundamental for accurate decision-making:
- Proper placement ensures key insights aren’t hidden behind other elements
- Readable fonts prevent misreading critical figures
- Adequate contrast between text/colors improves accessibility
Investors should prioritize well-designed legends tailored specifically toward their analytical needs rather than generic templates.
Future Trends In Chart Legend Design And Functionality
Looking ahead at developments shaping how we interpret financial visuals:
- Enhanced interactivity will become standard—allowing deeper dives into datasets via hover-over tooltips
- AI-driven customization will enable automatic adjustments based on user behavior patterns
- Integration with voice commands might allow verbal queries about specific dataset components during live analysis sessions
Such innovations aim not only at improving usability but also at empowering investors through smarter insights extraction from complex market data.
Risks Associated With Poorly Designed Or Misused Legends
Misinterpretation stemming from inadequate labeling poses significant risks:
- Making trades based on misunderstood signals could result in substantial losses
- Overcomplicated legends may deter thorough analysis altogether
- Technical failures might leave traders blindfolded during critical moments
Therefore—as part of responsible investing—it’s essential always to verify that your chart’s legend accurately reflects its contents before acting upon any visualized information.
Enhancing Your Data Interpretation Skills Through Better Visuals
Investors aiming for better outcomes should focus not only on collecting high-quality data but also mastering how it’s visually represented:
- Regularly familiarize yourself with common symbols used across platforms
- Practice reading various types of graphs—including candlestick patterns,volume histograms,moving averages,trendlines,indicators like RSI & MACD
This ongoing education improves confidence while reducing reliance solely on raw numbers—a key step toward becoming proficient at technical analysis.
Summary
A well-crafted chart legend plays a pivotal role in translating complex financial visuals into actionable insights — especially vital within fast-moving markets such as cryptocurrency trading where rapid interpretation influences success rates significantly . Advances like interactive features and AI-generated explanations continue enhancing this aspect further but require careful implementation lest they introduce new challenges such as complexity overloads or technical issues . By understanding its purpose—and applying best practices—you empower yourself with clearer perspectives needed for confident investment decisions.
Disclaimer:Contains third-party content. Not financial advice.
See Terms and Conditions.
What Are Related-Party Disclosures?
Related-party disclosures refer to the mandatory financial reporting requirements that compel companies to reveal transactions and relationships with related parties. These related parties include entities or individuals who have significant influence over the company, such as subsidiaries, affiliates, key management personnel, or owners with substantial control. The primary purpose of these disclosures is to provide transparency about dealings that could potentially influence a company's financial position or decision-making processes.
In practice, related-party disclosures encompass a wide range of transactions—such as loans, sales and purchases of goods or services, leases, guarantees, and other financial arrangements—that occur between the company and its related parties. These disclosures are typically included in the notes section of financial statements under standards like IFRS (International Financial Reporting Standards) and US GAAP (Generally Accepted Accounting Principles). They serve as an essential tool for stakeholders to assess whether such transactions are conducted at arm's length or if they might be influenced by personal interests.
Why Are Related-Party Disclosures Important?
The significance of related-party disclosures extends across multiple facets of corporate governance and investor protection. First and foremost, they enhance financial transparency by shedding light on dealings that could otherwise remain hidden from public view. When companies disclose their related-party transactions comprehensively, investors gain a clearer understanding of potential conflicts of interest that may impact the company's operations or profitability.
From a corporate governance perspective, these disclosures act as safeguards against unethical practices such as insider trading or favoritism. They enable boards of directors and regulators to monitor whether transactions are fair and justified rather than manipulated for personal gains by insiders or controlling shareholders.
Furthermore, adherence to standardized disclosure requirements promotes comparability across different companies within an industry or jurisdiction. This consistency allows investors to make more informed decisions based on reliable data rather than opaque arrangements hidden within complex corporate structures.
Regulatory bodies like the SEC in the United States enforce strict compliance with these disclosure standards because they play a vital role in maintaining market integrity. Failure to properly disclose related-party dealings can lead not only to legal penalties but also damage a company's reputation among investors.
How Do Related-Party Disclosures Support Investor Confidence?
Investors rely heavily on transparent financial reporting when making investment choices. When companies openly disclose their relationships with related parties—including details about transaction terms—they reduce information asymmetry that often exists between insiders and external stakeholders.
By providing detailed insights into how much money flows between affiliated entities—and whether those deals are conducted at fair market value—related-party disclosures help investors evaluate potential risks associated with conflicts of interest. For example:
- Are certain subsidiaries receiving favorable treatment?
- Do key executives benefit personally from specific deals?
- Is there any indication that some transactions might be used for earnings management?
Addressing these questions through transparent reporting builds trust in the company's integrity while enabling better risk assessment strategies for investors seeking long-term stability.
Additionally, comprehensive disclosures can prevent fraudulent activities by exposing irregularities early on before they escalate into scandals—like those seen historically in cases such as Enron—which ultimately benefits both shareholders and broader capital markets.
Recent Developments Enhancing Related-Party Disclosure Practices
The landscape surrounding related-party disclosures has evolved significantly over recent years due to legislative reforms, regulatory enforcement intensification, technological advancements—and high-profile scandals emphasizing their importance.
Legislative Changes
In 2025, U.S.-based lawmakers introduced new legislation aimed at strengthening ethical standards around related-party transactions. Notably modeled after previous efforts like the PELOSI Act (which focused on congressional ethics), this bill seeks stricter regulation enforcement concerning insider trading prevention linked directly with affiliated party dealings[1]. Such legislative initiatives reflect growing recognition among policymakers about safeguarding market fairness through enhanced transparency obligations.
Regulatory Actions
Regulators worldwide have increased scrutiny over compliance issues involving related-party disclosure requirements. The SEC has stepped up enforcement efforts during recent years—imposing fines on firms failing timely disclosure—or misrepresenting—their associated party dealings[1]. This trend underscores regulators' commitment toward ensuring consistent application across industries while deterring misconduct through tangible consequences for non-compliance.
Impactful Corporate Scandals
Historical cases like Enron’s collapse highlighted how lackluster disclosure practices regarding affiliated entity transactions can facilitate frauds leading to catastrophic outcomes[1]. More recently though high-profile scandals continue emphasizing this point; improved regulations aim at preventing similar incidents by mandating more rigorous reporting standards which foster accountability within organizations’ internal controls systems[1].
Technological Innovations
Advances in digital technology have transformed how companies manage their data—including complex webs of inter-company relationships—and facilitate real-time monitoring capabilities[2]. Automated systems now enable more accurate tracking & recording; however increased reliance also introduces cybersecurity risks—as exemplified recently during Coinbase’s 2025 data breach—that necessitate robust security measures alongside transparent reporting protocols[2].
Key Milestones & Dates Shaping Current Practices
Understanding historical milestones helps contextualize current trends:
2001: Enron scandal exposed severe deficiencies in disclosing affiliate-related party deals; prompted widespread reforms.
2010: Dodd–Frank Wall Street Reform Act mandated additional transparency around executive compensation & affiliated transaction reporting.
2020s: SEC intensified enforcement actions targeting non-compliance; fines became commonplace.
May 2025: Introduction of House Republicans’ bill aiming at tightening regulations further—reflecting ongoing legislative focus on ethical conduct concerning connected entities [1].
These developments underscore an ongoing global effort towards improving transparency standards—a critical component underpinning investor confidence today.[3]
References:
- [Research Article] Related Party Disclosures: Significance, Recent Developments
- Industry Reports & Regulatory Updates (e.g., SEC Enforcement Trends)
- Historical Case Studies: Enron & Dodd–Frank Impact Analysis
JCUSER-WVMdslBw
2025-05-19 15:32
What is the significance of related-party disclosures?
What Are Related-Party Disclosures?
Related-party disclosures refer to the mandatory financial reporting requirements that compel companies to reveal transactions and relationships with related parties. These related parties include entities or individuals who have significant influence over the company, such as subsidiaries, affiliates, key management personnel, or owners with substantial control. The primary purpose of these disclosures is to provide transparency about dealings that could potentially influence a company's financial position or decision-making processes.
In practice, related-party disclosures encompass a wide range of transactions—such as loans, sales and purchases of goods or services, leases, guarantees, and other financial arrangements—that occur between the company and its related parties. These disclosures are typically included in the notes section of financial statements under standards like IFRS (International Financial Reporting Standards) and US GAAP (Generally Accepted Accounting Principles). They serve as an essential tool for stakeholders to assess whether such transactions are conducted at arm's length or if they might be influenced by personal interests.
Why Are Related-Party Disclosures Important?
The significance of related-party disclosures extends across multiple facets of corporate governance and investor protection. First and foremost, they enhance financial transparency by shedding light on dealings that could otherwise remain hidden from public view. When companies disclose their related-party transactions comprehensively, investors gain a clearer understanding of potential conflicts of interest that may impact the company's operations or profitability.
From a corporate governance perspective, these disclosures act as safeguards against unethical practices such as insider trading or favoritism. They enable boards of directors and regulators to monitor whether transactions are fair and justified rather than manipulated for personal gains by insiders or controlling shareholders.
Furthermore, adherence to standardized disclosure requirements promotes comparability across different companies within an industry or jurisdiction. This consistency allows investors to make more informed decisions based on reliable data rather than opaque arrangements hidden within complex corporate structures.
Regulatory bodies like the SEC in the United States enforce strict compliance with these disclosure standards because they play a vital role in maintaining market integrity. Failure to properly disclose related-party dealings can lead not only to legal penalties but also damage a company's reputation among investors.
How Do Related-Party Disclosures Support Investor Confidence?
Investors rely heavily on transparent financial reporting when making investment choices. When companies openly disclose their relationships with related parties—including details about transaction terms—they reduce information asymmetry that often exists between insiders and external stakeholders.
By providing detailed insights into how much money flows between affiliated entities—and whether those deals are conducted at fair market value—related-party disclosures help investors evaluate potential risks associated with conflicts of interest. For example:
- Are certain subsidiaries receiving favorable treatment?
- Do key executives benefit personally from specific deals?
- Is there any indication that some transactions might be used for earnings management?
Addressing these questions through transparent reporting builds trust in the company's integrity while enabling better risk assessment strategies for investors seeking long-term stability.
Additionally, comprehensive disclosures can prevent fraudulent activities by exposing irregularities early on before they escalate into scandals—like those seen historically in cases such as Enron—which ultimately benefits both shareholders and broader capital markets.
Recent Developments Enhancing Related-Party Disclosure Practices
The landscape surrounding related-party disclosures has evolved significantly over recent years due to legislative reforms, regulatory enforcement intensification, technological advancements—and high-profile scandals emphasizing their importance.
Legislative Changes
In 2025, U.S.-based lawmakers introduced new legislation aimed at strengthening ethical standards around related-party transactions. Notably modeled after previous efforts like the PELOSI Act (which focused on congressional ethics), this bill seeks stricter regulation enforcement concerning insider trading prevention linked directly with affiliated party dealings[1]. Such legislative initiatives reflect growing recognition among policymakers about safeguarding market fairness through enhanced transparency obligations.
Regulatory Actions
Regulators worldwide have increased scrutiny over compliance issues involving related-party disclosure requirements. The SEC has stepped up enforcement efforts during recent years—imposing fines on firms failing timely disclosure—or misrepresenting—their associated party dealings[1]. This trend underscores regulators' commitment toward ensuring consistent application across industries while deterring misconduct through tangible consequences for non-compliance.
Impactful Corporate Scandals
Historical cases like Enron’s collapse highlighted how lackluster disclosure practices regarding affiliated entity transactions can facilitate frauds leading to catastrophic outcomes[1]. More recently though high-profile scandals continue emphasizing this point; improved regulations aim at preventing similar incidents by mandating more rigorous reporting standards which foster accountability within organizations’ internal controls systems[1].
Technological Innovations
Advances in digital technology have transformed how companies manage their data—including complex webs of inter-company relationships—and facilitate real-time monitoring capabilities[2]. Automated systems now enable more accurate tracking & recording; however increased reliance also introduces cybersecurity risks—as exemplified recently during Coinbase’s 2025 data breach—that necessitate robust security measures alongside transparent reporting protocols[2].
Key Milestones & Dates Shaping Current Practices
Understanding historical milestones helps contextualize current trends:
2001: Enron scandal exposed severe deficiencies in disclosing affiliate-related party deals; prompted widespread reforms.
2010: Dodd–Frank Wall Street Reform Act mandated additional transparency around executive compensation & affiliated transaction reporting.
2020s: SEC intensified enforcement actions targeting non-compliance; fines became commonplace.
May 2025: Introduction of House Republicans’ bill aiming at tightening regulations further—reflecting ongoing legislative focus on ethical conduct concerning connected entities [1].
These developments underscore an ongoing global effort towards improving transparency standards—a critical component underpinning investor confidence today.[3]
References:
- [Research Article] Related Party Disclosures: Significance, Recent Developments
- Industry Reports & Regulatory Updates (e.g., SEC Enforcement Trends)
- Historical Case Studies: Enron & Dodd–Frank Impact Analysis
Disclaimer:Contains third-party content. Not financial advice.
See Terms and Conditions.
What Should You Verify Before Sending a Cryptocurrency Transaction?
When engaging in cryptocurrency transactions, ensuring the accuracy and legitimacy of each transfer is vital to protect your assets and maintain financial safety. Unlike traditional banking, crypto transactions are irreversible once confirmed, making thorough verification essential. This guide provides a comprehensive overview of what you need to verify before sending a transaction, emphasizing best practices rooted in blockchain security principles.
Confirm the Recipient’s Wallet Address
One of the most critical steps before initiating any crypto transfer is verifying the recipient's wallet address. Blockchain addresses are long strings of alphanumeric characters that uniquely identify digital wallets. Due to their complexity, even minor errors can lead to lost funds or sending assets to unintended recipients.
Always double-check the address by copying and pasting it directly from trusted sources or scanning QR codes when available. Avoid manual entry unless necessary, as typos are common causes of transaction failures or asset loss. Some users employ checksum mechanisms embedded within certain address formats (like Bech32 for Bitcoin) that help detect invalid addresses automatically.
Validate Transaction Details: Amount and Currency
Before confirming a transaction, ensure that the amount you intend to send matches your intention precisely. Mistakes in specifying amounts can lead to significant financial discrepancies—sending too much or too little can be costly.
Additionally, verify that you're selecting the correct cryptocurrency token if dealing with multiple assets on one platform (e.g., ETH vs. ERC-20 tokens). Confirming these details prevents accidental transfers across different tokens or networks where they might not be compatible.
Check Network Compatibility and Fees
Different cryptocurrencies operate on distinct blockchains with unique protocols; therefore, verifying network compatibility is crucial—sending Bitcoin on an Ethereum network would result in failure or loss of funds. Ensure you're using the correct network for your transaction type.
Transaction fees vary depending on network congestion; higher fees typically mean faster confirmation times but also increased costs. Use reputable blockchain explorers or fee estimation tools (like those integrated into wallets) to determine appropriate fee levels based on current conditions—this helps avoid delays caused by underfunded transactions.
Verify Digital Signatures and Authentication
Cryptocurrency transactions rely heavily on cryptographic signatures for validation purposes. When you initiate a transfer from your wallet, it must be signed with your private key—a process ensuring authenticity and authorization.
Ensure that your wallet software correctly signs transactions without errors before submission. If using third-party services or exchanges, confirm they employ secure signing processes compliant with industry standards like multi-factor authentication (MFA) and hardware security modules (HSMs).
Conduct Due Diligence Against Scams
Crypto scams such as phishing attacks often target users during transaction processes by impersonating legitimate entities through fake websites or malicious links. Always verify you're interacting with official platforms—check URLs carefully for typos or suspicious domains—and avoid sharing sensitive information like private keys.
Research recipient addresses when possible—especially if receiving funds from unknown parties—to confirm their legitimacy through blockchain explorers which display associated activity history if publicly available.
Use Secure Wallets and Storage Practices
Your wallet’s security directly impacts transaction safety; weak passwords, unsecured devices, or compromised private keys increase vulnerability risks during transfers. Employ strong passwords combined with two-factor authentication (2FA), hardware wallets for large sums, and keep backup seed phrases stored securely offline away from potential threats like malware infections.
Regularly update wallet software to patch vulnerabilities identified through security audits; this proactive approach minimizes exposure during critical operations such as sending transactions.
Leverage Blockchain Explorers for Transparency
Blockchain explorers serve as invaluable tools allowing users to track their pending and confirmed transactions transparently in real-time—for example: Etherscan for Ethereum-based tokens or Blockchain.com for Bitcoin networks.By entering your transaction ID (hash), you can verify whether it has been included in a block yet—and monitor confirmation counts which influence settlement finality.This transparency helps build confidence that you've sent funds correctly while providing proof-of-transaction should disputes arise later.
Final Tips: Best Practices Before Sending Crypto Transactions
- Double-check all details — recipient address, amount, currency.
- Use reputable wallets equipped with robust security features.
- Verify network conditions — fees & congestion levels.
- Confirm signatures have been properly applied via secure signing methods.
- Stay vigilant against scams — always authenticate sources before proceeding.
- Monitor via blockchain explorers until confirmation completes.
By adhering to these verification steps rooted in blockchain technology's core principles of cryptography & decentralization—and staying vigilant against common pitfalls—you significantly reduce risks associated with crypto transfers while safeguarding your digital assets effectively.
References
- "Blockchain Security: A Comprehensive Guide" by Blockchain Council
2."Smart Contracts: The Future of Blockchain" by CoinDesk
3."How Blockchain Transactions Are Verified" by Investopedia
4."Blockchain Explorer: A Tool for Transparency" by CryptoSlate
5."Due Diligence in Crypto Transactions" by Coindoo
6."Wallet Security Best Practices" by Binance Academy
7."Layer 2 Solutions: Enhancing Blockchain Scalability" by The Block
8."Regulatory Clarity in Crypto: A Global Perspective" by Forbes
9."Crypto Scams: How to Avoid Them" by Cointelegraph
10.“Smart Contract Security Risks” by Medium
kai
2025-05-15 00:48
What should you verify before sending a transaction?
What Should You Verify Before Sending a Cryptocurrency Transaction?
When engaging in cryptocurrency transactions, ensuring the accuracy and legitimacy of each transfer is vital to protect your assets and maintain financial safety. Unlike traditional banking, crypto transactions are irreversible once confirmed, making thorough verification essential. This guide provides a comprehensive overview of what you need to verify before sending a transaction, emphasizing best practices rooted in blockchain security principles.
Confirm the Recipient’s Wallet Address
One of the most critical steps before initiating any crypto transfer is verifying the recipient's wallet address. Blockchain addresses are long strings of alphanumeric characters that uniquely identify digital wallets. Due to their complexity, even minor errors can lead to lost funds or sending assets to unintended recipients.
Always double-check the address by copying and pasting it directly from trusted sources or scanning QR codes when available. Avoid manual entry unless necessary, as typos are common causes of transaction failures or asset loss. Some users employ checksum mechanisms embedded within certain address formats (like Bech32 for Bitcoin) that help detect invalid addresses automatically.
Validate Transaction Details: Amount and Currency
Before confirming a transaction, ensure that the amount you intend to send matches your intention precisely. Mistakes in specifying amounts can lead to significant financial discrepancies—sending too much or too little can be costly.
Additionally, verify that you're selecting the correct cryptocurrency token if dealing with multiple assets on one platform (e.g., ETH vs. ERC-20 tokens). Confirming these details prevents accidental transfers across different tokens or networks where they might not be compatible.
Check Network Compatibility and Fees
Different cryptocurrencies operate on distinct blockchains with unique protocols; therefore, verifying network compatibility is crucial—sending Bitcoin on an Ethereum network would result in failure or loss of funds. Ensure you're using the correct network for your transaction type.
Transaction fees vary depending on network congestion; higher fees typically mean faster confirmation times but also increased costs. Use reputable blockchain explorers or fee estimation tools (like those integrated into wallets) to determine appropriate fee levels based on current conditions—this helps avoid delays caused by underfunded transactions.
Verify Digital Signatures and Authentication
Cryptocurrency transactions rely heavily on cryptographic signatures for validation purposes. When you initiate a transfer from your wallet, it must be signed with your private key—a process ensuring authenticity and authorization.
Ensure that your wallet software correctly signs transactions without errors before submission. If using third-party services or exchanges, confirm they employ secure signing processes compliant with industry standards like multi-factor authentication (MFA) and hardware security modules (HSMs).
Conduct Due Diligence Against Scams
Crypto scams such as phishing attacks often target users during transaction processes by impersonating legitimate entities through fake websites or malicious links. Always verify you're interacting with official platforms—check URLs carefully for typos or suspicious domains—and avoid sharing sensitive information like private keys.
Research recipient addresses when possible—especially if receiving funds from unknown parties—to confirm their legitimacy through blockchain explorers which display associated activity history if publicly available.
Use Secure Wallets and Storage Practices
Your wallet’s security directly impacts transaction safety; weak passwords, unsecured devices, or compromised private keys increase vulnerability risks during transfers. Employ strong passwords combined with two-factor authentication (2FA), hardware wallets for large sums, and keep backup seed phrases stored securely offline away from potential threats like malware infections.
Regularly update wallet software to patch vulnerabilities identified through security audits; this proactive approach minimizes exposure during critical operations such as sending transactions.
Leverage Blockchain Explorers for Transparency
Blockchain explorers serve as invaluable tools allowing users to track their pending and confirmed transactions transparently in real-time—for example: Etherscan for Ethereum-based tokens or Blockchain.com for Bitcoin networks.By entering your transaction ID (hash), you can verify whether it has been included in a block yet—and monitor confirmation counts which influence settlement finality.This transparency helps build confidence that you've sent funds correctly while providing proof-of-transaction should disputes arise later.
Final Tips: Best Practices Before Sending Crypto Transactions
- Double-check all details — recipient address, amount, currency.
- Use reputable wallets equipped with robust security features.
- Verify network conditions — fees & congestion levels.
- Confirm signatures have been properly applied via secure signing methods.
- Stay vigilant against scams — always authenticate sources before proceeding.
- Monitor via blockchain explorers until confirmation completes.
By adhering to these verification steps rooted in blockchain technology's core principles of cryptography & decentralization—and staying vigilant against common pitfalls—you significantly reduce risks associated with crypto transfers while safeguarding your digital assets effectively.
References
- "Blockchain Security: A Comprehensive Guide" by Blockchain Council
2."Smart Contracts: The Future of Blockchain" by CoinDesk
3."How Blockchain Transactions Are Verified" by Investopedia
4."Blockchain Explorer: A Tool for Transparency" by CryptoSlate
5."Due Diligence in Crypto Transactions" by Coindoo
6."Wallet Security Best Practices" by Binance Academy
7."Layer 2 Solutions: Enhancing Blockchain Scalability" by The Block
8."Regulatory Clarity in Crypto: A Global Perspective" by Forbes
9."Crypto Scams: How to Avoid Them" by Cointelegraph
10.“Smart Contract Security Risks” by Medium
Disclaimer:Contains third-party content. Not financial advice.
See Terms and Conditions.
How to Optimize Gap Strategies for Earnings Gaps in Financial Markets
Understanding Gap Strategies and Earnings Gaps
Gap strategies are investment techniques designed to capitalize on temporary price discrepancies between financial instruments. These discrepancies often occur due to market inefficiencies, news releases, or earnings reports. In particular, earnings gaps refer to the difference between a company's actual reported earnings and what analysts or investors expected. When a company reports earnings that significantly differ from forecasts—either positively or negatively—it can create a gap in the stock price, presenting opportunities for traders who can anticipate and react swiftly.
In the context of financial markets, especially with volatile assets like cryptocurrencies, identifying and exploiting these gaps requires a combination of analytical tools and strategic planning. Investors aim to predict when an earnings gap will occur or identify its impact early enough to profit before the market adjusts.
Key Steps in Optimizing Gap Strategies for Earnings Gaps
- Conduct Thorough Market Analysis
The foundation of effective gap trading lies in comprehensive market analysis. This involves monitoring financial news outlets, earning reports scheduled by companies, macroeconomic indicators, and overall market sentiment. By staying informed about upcoming earnings releases and potential catalysts—such as regulatory changes or geopolitical events—investors can better anticipate where gaps might form.
Additionally, analyzing historical data on past earnings surprises helps identify patterns that could repeat under similar circumstances. For example, some sectors tend to experience more frequent positive surprises than others; recognizing these trends enhances predictive accuracy.
- Gather Historical Data on Earnings Gaps
Building a database of previous earnings gaps allows traders to understand their frequency, size distribution, and typical impact on asset prices. Statistical analysis of this data reveals probabilities associated with different types of gaps (upward vs downward) under various conditions.
This historical perspective aids in setting realistic expectations regarding potential gains and risks associated with specific trades based on prior occurrences.
- Implement Robust Risk Management Techniques
Given the inherent unpredictability of markets—and especially high-volatility assets like cryptocurrencies—risk management is crucial when deploying gap strategies. Setting stop-loss orders ensures losses are contained if an anticipated move does not materialize as expected.
Diversification across multiple assets reduces exposure risk related to any single event triggering an adverse movement. Position sizing should also be carefully calibrated based on volatility levels; larger positions may be justified during periods of high confidence but should always include safeguards against sudden reversals.
- Utilize Technical Indicators Effectively
Technical analysis complements fundamental insights by providing real-time signals about potential price movements around earning dates or identified gaps:
- Moving Averages: Help determine trend direction.
- Bollinger Bands: Indicate volatility levels that may precede significant moves.
- Relative Strength Index (RSI): Highlights overbought or oversold conditions which could signal impending reversals post-gap closure.
Combining these indicators improves timing precision when entering or exiting trades related to earning surprises.
- Leverage Algorithmic Trading Tools
Automation through algorithmic trading platforms enables rapid identification of price discrepancies aligned with predefined criteria such as volume spikes around earning reports or technical indicator thresholds linked with historical gap patterns.
Algorithms can process vast datasets faster than manual methods — crucial for capturing fleeting opportunities before they close as markets adjust post-announcement.
Recent Developments Enhancing Gap Strategy Optimization
Advances in artificial intelligence (AI) and machine learning (ML) have revolutionized how traders approach gap strategies today:
AI-Powered Prediction Models: These models analyze massive datasets—including social media sentiment, news feeds, macroeconomic variables—to forecast potential earning surprises more accurately.
Real-Time Data Processing: ML algorithms continuously monitor live market data streams for anomalies indicative of upcoming gaps — enabling quicker decision-making.
The rise of cryptocurrency markets has further expanded opportunities for applying optimized gap strategies due to their high liquidity combined with extreme volatility levels that often produce sizable pricing discrepancies following major events like protocol upgrades or regulatory announcements.
Impacting Factors: Regulatory Changes & Market Volatility
Regulatory developments significantly influence how effectively traders can implement gap strategies:
New tax laws might alter investor behavior by increasing transaction costs.
Securities regulation adjustments could restrict certain trading practices temporarily affecting strategy deployment.
Market volatility also plays a dual role: while it amplifies profit potentials from large gaps during turbulent periods — it simultaneously raises risks due to unpredictable swings that may negate initial assumptions.
Risks Associated With Gap Trading During Earnings Events
Despite their profitability prospects, employing gap strategies involves notable risks:
Market Volatility: Sudden shifts driven by unforeseen news can lead prices far beyond anticipated ranges.
Information Overload: The sheer volume of available data might overwhelm traders leading them astray without proper filtering mechanisms.
Psychological Biases: Emotional reactions such as fear-of-missing-out (FOMO) may cause impulsive decisions contrary to strategic plans.
Best Practices for Effective Implementation
To maximize success while mitigating risks when optimizing gap strategies around earnings:
- Maintain disciplined adherence to predefined entry/exit points based on technical signals rather than emotions.
- Continuously update models using recent data inputs reflecting current market conditions.
- Use diversification across sectors/assets where possible so adverse moves do not wipe out entire portfolios.4.. Regularly review risk management protocols including stop-loss placements aligned with changing volatility landscapes.
Staying Informed About Market Trends
Successful application depends heavily on staying updated about evolving trends influencing both traditional stocks and cryptocurrencies alike:
- Follow credible financial news sources.*
- Monitor scheduled corporate disclosures.*
- Keep abreast of regulatory updates impacting trading environments.*
By integrating fundamental insights with technical tools enhanced through AI/ML innovations—and maintaining disciplined risk controls—investors can better position themselves within dynamic markets prone to frequent earning-related price movements.
Enhancing Your Strategy Through Continuous Learning
Finally—and perhaps most importantly—the landscape surrounding gap trading is constantly evolving thanks largely due to technological advancements and shifting regulations.* Engaging regularly in educational resources such as webinars*, industry reports*, forums*, helps refine your approach over time.* Staying adaptable ensures you remain competitive regardless of changing market dynamics.*
Optimizing your approach toward exploiting earnings gaps via well-informed strategy development offers significant advantages—but only if executed thoughtfully within a framework emphasizing risk management alongside technological innovation.* Combining fundamental research with cutting-edge tools empowers investors seeking consistent gains amid volatile environments like cryptocurrency markets.*
Lo
2025-05-14 04:37
How can gap strategies be optimized for earnings gaps?
How to Optimize Gap Strategies for Earnings Gaps in Financial Markets
Understanding Gap Strategies and Earnings Gaps
Gap strategies are investment techniques designed to capitalize on temporary price discrepancies between financial instruments. These discrepancies often occur due to market inefficiencies, news releases, or earnings reports. In particular, earnings gaps refer to the difference between a company's actual reported earnings and what analysts or investors expected. When a company reports earnings that significantly differ from forecasts—either positively or negatively—it can create a gap in the stock price, presenting opportunities for traders who can anticipate and react swiftly.
In the context of financial markets, especially with volatile assets like cryptocurrencies, identifying and exploiting these gaps requires a combination of analytical tools and strategic planning. Investors aim to predict when an earnings gap will occur or identify its impact early enough to profit before the market adjusts.
Key Steps in Optimizing Gap Strategies for Earnings Gaps
- Conduct Thorough Market Analysis
The foundation of effective gap trading lies in comprehensive market analysis. This involves monitoring financial news outlets, earning reports scheduled by companies, macroeconomic indicators, and overall market sentiment. By staying informed about upcoming earnings releases and potential catalysts—such as regulatory changes or geopolitical events—investors can better anticipate where gaps might form.
Additionally, analyzing historical data on past earnings surprises helps identify patterns that could repeat under similar circumstances. For example, some sectors tend to experience more frequent positive surprises than others; recognizing these trends enhances predictive accuracy.
- Gather Historical Data on Earnings Gaps
Building a database of previous earnings gaps allows traders to understand their frequency, size distribution, and typical impact on asset prices. Statistical analysis of this data reveals probabilities associated with different types of gaps (upward vs downward) under various conditions.
This historical perspective aids in setting realistic expectations regarding potential gains and risks associated with specific trades based on prior occurrences.
- Implement Robust Risk Management Techniques
Given the inherent unpredictability of markets—and especially high-volatility assets like cryptocurrencies—risk management is crucial when deploying gap strategies. Setting stop-loss orders ensures losses are contained if an anticipated move does not materialize as expected.
Diversification across multiple assets reduces exposure risk related to any single event triggering an adverse movement. Position sizing should also be carefully calibrated based on volatility levels; larger positions may be justified during periods of high confidence but should always include safeguards against sudden reversals.
- Utilize Technical Indicators Effectively
Technical analysis complements fundamental insights by providing real-time signals about potential price movements around earning dates or identified gaps:
- Moving Averages: Help determine trend direction.
- Bollinger Bands: Indicate volatility levels that may precede significant moves.
- Relative Strength Index (RSI): Highlights overbought or oversold conditions which could signal impending reversals post-gap closure.
Combining these indicators improves timing precision when entering or exiting trades related to earning surprises.
- Leverage Algorithmic Trading Tools
Automation through algorithmic trading platforms enables rapid identification of price discrepancies aligned with predefined criteria such as volume spikes around earning reports or technical indicator thresholds linked with historical gap patterns.
Algorithms can process vast datasets faster than manual methods — crucial for capturing fleeting opportunities before they close as markets adjust post-announcement.
Recent Developments Enhancing Gap Strategy Optimization
Advances in artificial intelligence (AI) and machine learning (ML) have revolutionized how traders approach gap strategies today:
AI-Powered Prediction Models: These models analyze massive datasets—including social media sentiment, news feeds, macroeconomic variables—to forecast potential earning surprises more accurately.
Real-Time Data Processing: ML algorithms continuously monitor live market data streams for anomalies indicative of upcoming gaps — enabling quicker decision-making.
The rise of cryptocurrency markets has further expanded opportunities for applying optimized gap strategies due to their high liquidity combined with extreme volatility levels that often produce sizable pricing discrepancies following major events like protocol upgrades or regulatory announcements.
Impacting Factors: Regulatory Changes & Market Volatility
Regulatory developments significantly influence how effectively traders can implement gap strategies:
New tax laws might alter investor behavior by increasing transaction costs.
Securities regulation adjustments could restrict certain trading practices temporarily affecting strategy deployment.
Market volatility also plays a dual role: while it amplifies profit potentials from large gaps during turbulent periods — it simultaneously raises risks due to unpredictable swings that may negate initial assumptions.
Risks Associated With Gap Trading During Earnings Events
Despite their profitability prospects, employing gap strategies involves notable risks:
Market Volatility: Sudden shifts driven by unforeseen news can lead prices far beyond anticipated ranges.
Information Overload: The sheer volume of available data might overwhelm traders leading them astray without proper filtering mechanisms.
Psychological Biases: Emotional reactions such as fear-of-missing-out (FOMO) may cause impulsive decisions contrary to strategic plans.
Best Practices for Effective Implementation
To maximize success while mitigating risks when optimizing gap strategies around earnings:
- Maintain disciplined adherence to predefined entry/exit points based on technical signals rather than emotions.
- Continuously update models using recent data inputs reflecting current market conditions.
- Use diversification across sectors/assets where possible so adverse moves do not wipe out entire portfolios.4.. Regularly review risk management protocols including stop-loss placements aligned with changing volatility landscapes.
Staying Informed About Market Trends
Successful application depends heavily on staying updated about evolving trends influencing both traditional stocks and cryptocurrencies alike:
- Follow credible financial news sources.*
- Monitor scheduled corporate disclosures.*
- Keep abreast of regulatory updates impacting trading environments.*
By integrating fundamental insights with technical tools enhanced through AI/ML innovations—and maintaining disciplined risk controls—investors can better position themselves within dynamic markets prone to frequent earning-related price movements.
Enhancing Your Strategy Through Continuous Learning
Finally—and perhaps most importantly—the landscape surrounding gap trading is constantly evolving thanks largely due to technological advancements and shifting regulations.* Engaging regularly in educational resources such as webinars*, industry reports*, forums*, helps refine your approach over time.* Staying adaptable ensures you remain competitive regardless of changing market dynamics.*
Optimizing your approach toward exploiting earnings gaps via well-informed strategy development offers significant advantages—but only if executed thoughtfully within a framework emphasizing risk management alongside technological innovation.* Combining fundamental research with cutting-edge tools empowers investors seeking consistent gains amid volatile environments like cryptocurrency markets.*
Disclaimer:Contains third-party content. Not financial advice.
See Terms and Conditions.
How Can DMI Be Used to Define Trend Strength Thresholds?
Understanding trend strength is essential for traders and investors aiming to make informed decisions in financial markets, including cryptocurrencies. The Directional Movement Index (DMI), developed by J. Wells Wilder, offers a reliable way to quantify the strength and direction of market trends. By effectively interpreting DMI signals—particularly the ADX line—traders can set meaningful thresholds that help identify when a trend is strong enough to warrant action.
What Is the Directional Movement Index (DMI)?
The DMI comprises three key components: the +DI (Positive Directional Indicator), -DI (Negative Directional Indicator), and ADX (Average Directional Index). The +DI and -DI lines indicate whether an upward or downward movement dominates, providing insight into trend direction. Meanwhile, the ADX measures overall trend strength regardless of direction.
Developed by Wilder in the 1970s, this indicator has stood the test of time due to its simplicity and effectiveness. It helps traders distinguish between trending markets and sideways consolidations—a critical factor for timing entries and exits.
Interpreting ADX Values for Trend Strength
The core utility of DMI lies in its ability to quantify how strong a current trend is through specific threshold levels on the ADX line:
- 0-25: Indicates weak or no clear trend; markets may be ranging.
- 26-50: Signifies developing or moderate trends.
- 51-75: Represents strong trending conditions.
- 76+: Suggests extremely powerful trends with high momentum.
These thresholds serve as practical benchmarks for traders seeking confirmation before executing trades. For example, an ADX crossing above 50 could signal that a significant move is underway, prompting traders to consider entering positions aligned with prevailing momentum.
Setting Effective Trend Strength Thresholds
To leverage DMI effectively, traders often establish specific rules based on these threshold levels:
- When ADX crosses above 25, it may indicate that a new or ongoing trend has gained enough momentum.
- An ADX rising above 50 can be viewed as confirmation of an extremely strong market move—ideal for aggressive trading strategies.
- Conversely, if ADX remains below 25, it suggests low volatility or sideways movement; trading strategies should be cautious during such periods.
Combining these thresholds with other technical indicators enhances decision-making accuracy—for instance:
- Confirming an uptrend when +DI > -DI alongside high ADX values.
- Recognizing potential reversals if +DI crosses below -DI during declining ADX readings.
This layered approach reduces false signals often encountered when relying solely on one indicator.
Enhancing Trend Analysis Through Multi-indicator Strategies
While DMI provides valuable insights into trend strength and direction, integrating it with other tools improves reliability:
- Moving averages can confirm whether price action aligns with identified trends.
- Relative Strength Index (RSI) helps assess overbought or oversold conditions within trending phases indicated by DMI.
For example:
An asset shows an ADX rising above 50 while RSI indicates overbought conditions. This combination might suggest a very strong uptrend nearing exhaustion—prompting caution rather than immediate entry.
Using multiple indicators together ensures more robust analysis aligned with user intent—to confirm genuine breakouts versus false signals caused by market noise.
Recent Trends: AI Integration & Cryptocurrency Markets
In recent years, technological advancements have expanded how traders utilize DMI in practice. Artificial intelligence (AI) algorithms now analyze large datasets—including historical price movements combined with real-time DMI signals—to automate detection of significant trend shifts based on predefined thresholds like those discussed earlier.
This automation allows for quicker responses amid volatile environments such as cryptocurrency markets where rapid changes are common. Cryptocurrencies' inherent volatility makes traditional analysis challenging; however, combining AI-driven models with tools like DMI enhances predictive accuracy regarding emerging trends' strength levels.
Furthermore, community adoption has grown significantly within crypto circles—online forums frequently discuss setting custom threshold levels tailored to specific assets’ behavior patterns rather than rigid standards alone.
Potential Pitfalls When Using DMI Thresholds
Despite its strengths, overreliance on any single indicator—including DMI—can lead to pitfalls such as false signals during sudden market swings or whipsaws in choppy conditions. Market volatility especially impacts cryptocurrencies where abrupt price moves are frequent; thus,
Traders should always corroborate findings from DMI-based thresholds with fundamental analysis, news events,and other technical tools like volume indicators or candlestick patterns.
Additionally,
Regulatory developments can influence how these technical tools are applied across different jurisdictions—for instance,new laws affecting crypto trading might alter typical market behaviors,making previously reliable thresholds less effective temporarily.
Best Practices for Using Trend Thresholds Effectively
To maximize benefits from using DMI-based thresholds:
- Combine multiple indicators rather than relying solely on one metric.
- Adjust threshold levels according to asset-specific behavior; some assets may require higher/lower cutoffs due to their unique volatility profiles.
- Use alerts triggered at key threshold crossings—for example,notifying when ADX surpasses 50—to facilitate timely decision-making without constant monitoring.
By adhering to these practices rooted in sound technical analysis principles—and understanding both their strengths and limitations—you improve your chances of accurately capturing profitable trends while minimizing risks associated with false signals.
Final Thoughts: Applying Knowledge Strategically
Using the Directional Movement Index's threshold levels offers valuable insights into current market dynamics across various asset classes—including cryptocurrencies—and supports strategic trade planning based on quantifiable data points about trend strength and directionality.
By integrating modern technologies like AI-driven analytics alongside traditional methods—and maintaining awareness about potential pitfalls—you position yourself better within competitive markets where timing matters most.
Ultimately,
a disciplined approach combining well-understood indicator thresholds like those provided by the DMI will enhance your ability not only to identify promising opportunities but also manage risk more effectively amidst ever-changing financial landscapes.
JCUSER-WVMdslBw
2025-05-09 11:43
How can DMI be used to define trend strength thresholds?
How Can DMI Be Used to Define Trend Strength Thresholds?
Understanding trend strength is essential for traders and investors aiming to make informed decisions in financial markets, including cryptocurrencies. The Directional Movement Index (DMI), developed by J. Wells Wilder, offers a reliable way to quantify the strength and direction of market trends. By effectively interpreting DMI signals—particularly the ADX line—traders can set meaningful thresholds that help identify when a trend is strong enough to warrant action.
What Is the Directional Movement Index (DMI)?
The DMI comprises three key components: the +DI (Positive Directional Indicator), -DI (Negative Directional Indicator), and ADX (Average Directional Index). The +DI and -DI lines indicate whether an upward or downward movement dominates, providing insight into trend direction. Meanwhile, the ADX measures overall trend strength regardless of direction.
Developed by Wilder in the 1970s, this indicator has stood the test of time due to its simplicity and effectiveness. It helps traders distinguish between trending markets and sideways consolidations—a critical factor for timing entries and exits.
Interpreting ADX Values for Trend Strength
The core utility of DMI lies in its ability to quantify how strong a current trend is through specific threshold levels on the ADX line:
- 0-25: Indicates weak or no clear trend; markets may be ranging.
- 26-50: Signifies developing or moderate trends.
- 51-75: Represents strong trending conditions.
- 76+: Suggests extremely powerful trends with high momentum.
These thresholds serve as practical benchmarks for traders seeking confirmation before executing trades. For example, an ADX crossing above 50 could signal that a significant move is underway, prompting traders to consider entering positions aligned with prevailing momentum.
Setting Effective Trend Strength Thresholds
To leverage DMI effectively, traders often establish specific rules based on these threshold levels:
- When ADX crosses above 25, it may indicate that a new or ongoing trend has gained enough momentum.
- An ADX rising above 50 can be viewed as confirmation of an extremely strong market move—ideal for aggressive trading strategies.
- Conversely, if ADX remains below 25, it suggests low volatility or sideways movement; trading strategies should be cautious during such periods.
Combining these thresholds with other technical indicators enhances decision-making accuracy—for instance:
- Confirming an uptrend when +DI > -DI alongside high ADX values.
- Recognizing potential reversals if +DI crosses below -DI during declining ADX readings.
This layered approach reduces false signals often encountered when relying solely on one indicator.
Enhancing Trend Analysis Through Multi-indicator Strategies
While DMI provides valuable insights into trend strength and direction, integrating it with other tools improves reliability:
- Moving averages can confirm whether price action aligns with identified trends.
- Relative Strength Index (RSI) helps assess overbought or oversold conditions within trending phases indicated by DMI.
For example:
An asset shows an ADX rising above 50 while RSI indicates overbought conditions. This combination might suggest a very strong uptrend nearing exhaustion—prompting caution rather than immediate entry.
Using multiple indicators together ensures more robust analysis aligned with user intent—to confirm genuine breakouts versus false signals caused by market noise.
Recent Trends: AI Integration & Cryptocurrency Markets
In recent years, technological advancements have expanded how traders utilize DMI in practice. Artificial intelligence (AI) algorithms now analyze large datasets—including historical price movements combined with real-time DMI signals—to automate detection of significant trend shifts based on predefined thresholds like those discussed earlier.
This automation allows for quicker responses amid volatile environments such as cryptocurrency markets where rapid changes are common. Cryptocurrencies' inherent volatility makes traditional analysis challenging; however, combining AI-driven models with tools like DMI enhances predictive accuracy regarding emerging trends' strength levels.
Furthermore, community adoption has grown significantly within crypto circles—online forums frequently discuss setting custom threshold levels tailored to specific assets’ behavior patterns rather than rigid standards alone.
Potential Pitfalls When Using DMI Thresholds
Despite its strengths, overreliance on any single indicator—including DMI—can lead to pitfalls such as false signals during sudden market swings or whipsaws in choppy conditions. Market volatility especially impacts cryptocurrencies where abrupt price moves are frequent; thus,
Traders should always corroborate findings from DMI-based thresholds with fundamental analysis, news events,and other technical tools like volume indicators or candlestick patterns.
Additionally,
Regulatory developments can influence how these technical tools are applied across different jurisdictions—for instance,new laws affecting crypto trading might alter typical market behaviors,making previously reliable thresholds less effective temporarily.
Best Practices for Using Trend Thresholds Effectively
To maximize benefits from using DMI-based thresholds:
- Combine multiple indicators rather than relying solely on one metric.
- Adjust threshold levels according to asset-specific behavior; some assets may require higher/lower cutoffs due to their unique volatility profiles.
- Use alerts triggered at key threshold crossings—for example,notifying when ADX surpasses 50—to facilitate timely decision-making without constant monitoring.
By adhering to these practices rooted in sound technical analysis principles—and understanding both their strengths and limitations—you improve your chances of accurately capturing profitable trends while minimizing risks associated with false signals.
Final Thoughts: Applying Knowledge Strategically
Using the Directional Movement Index's threshold levels offers valuable insights into current market dynamics across various asset classes—including cryptocurrencies—and supports strategic trade planning based on quantifiable data points about trend strength and directionality.
By integrating modern technologies like AI-driven analytics alongside traditional methods—and maintaining awareness about potential pitfalls—you position yourself better within competitive markets where timing matters most.
Ultimately,
a disciplined approach combining well-understood indicator thresholds like those provided by the DMI will enhance your ability not only to identify promising opportunities but also manage risk more effectively amidst ever-changing financial landscapes.
Disclaimer:Contains third-party content. Not financial advice.
See Terms and Conditions.
How to Set Stop-Loss Levels Around Chart Patterns in Trading
Effective risk management is essential for successful trading, especially in volatile markets like cryptocurrencies. One of the most important tools traders use to limit potential losses is the stop-loss order. When combined with technical analysis—particularly chart patterns—setting appropriate stop-loss levels can significantly improve trading outcomes. This guide provides a comprehensive overview of how to set stop-loss levels around chart patterns, ensuring you make informed decisions that balance risk and reward.
Understanding Stop-Loss Orders and Their Role in Trading
A stop-loss order is an automatic instruction to sell a security once its price reaches a predetermined level. Its primary purpose is to protect traders from significant losses if the market moves against their position. In practice, setting a well-placed stop-loss helps prevent emotional decision-making during volatile market swings and ensures disciplined trading.
In the context of chart patterns, stop-loss levels are strategically placed based on expected price movements associated with specific formations. Proper placement requires understanding both the pattern's characteristics and current market conditions.
Common Chart Patterns Used for Trade Entries
Chart patterns visually represent historical price movements and help predict future trends when interpreted correctly. Recognizing these formations allows traders to identify potential entry points and determine where to place their stops.
Head and Shoulders
This pattern signals a potential trend reversal from bullish to bearish or vice versa. It features three peaks: a higher middle peak (head) flanked by two lower peaks (shoulders). The neckline connects the lows between these peaks; breaking below this line often indicates further downside movement.
Triangles
Triangles are consolidation patterns formed by converging trendlines connecting higher lows and lower highs:
- Symmetrical Triangle: Indicates indecision; breakout direction suggests future trend.
- Ascending Triangle: Bullish continuation pattern.
- Descending Triangle: Bearish continuation pattern.
Wedges
Wedges resemble triangles but have sloped boundaries indicating strong trending behavior before reversal or continuation:
- Rising Wedge: Usually bearish.
- Falling Wedge: Often bullish.
Reversal Patterns: Double Tops & Bottoms
Double tops suggest an impending downtrend after two failed attempts at breaking resistance, while double bottoms indicate potential upward reversals after testing support twice.
Strategies for Setting Stop-Loss Levels Based on Chart Patterns
Choosing where to place your stop-loss depends on your analysis of each pattern’s structure, volatility considerations, and your risk appetite. There are generally two approaches:
Conservative Approach
This method involves placing stops close enough that minor fluctuations won't trigger them unnecessarily but still provide protection against significant adverse moves:
- For head-and-shoulders: Just below the neckline in a bearish setup.
- For bullish reversal patterns: Slightly below key support levels or recent swing lows.
This approach minimizes losses but may result in more frequent triggers due to normal market noise.
Aggressive Approach
Here, stops are set further away from entry points—just above resistance levels in bearish setups or just below support lines in bullish scenarios—to avoid premature exits caused by minor retracements:
- For bearish breakouts: Slightly above resistance zones.
- For bullish breakouts: Slightly below support zones.
While this reduces false triggers, it exposes traders to larger potential losses if the trade goes wrong quickly.
Incorporating Technical Indicators for Better Stop Placement
Using additional technical tools can enhance your ability to set effective stop-loss levels around chart patterns:
- Moving Averages – Placing stops just beyond key moving average lines (e.g., 50-day MA) can provide dynamic support/resistance references.
- Relative Strength Index (RSI) – Overbought or oversold conditions may influence where you place stops relative to overextension zones.
- Bollinger Bands – These volatility bands help identify extreme price deviations; placing stops outside these bands can prevent being stopped out prematurely during normal fluctuations.
Combining these indicators with chart pattern analysis offers more robust risk management strategies aligned with current market dynamics.
Managing Risks Specific To Cryptocurrency Markets
Cryptocurrency markets are known for their high volatility compared to traditional assets like stocks or forex pairs. This characteristic makes precise stop-loss placement even more critical because sudden gaps or sharp moves can trigger orders unexpectedly—a phenomenon known as "market gaps."
To mitigate such risks:
- Use wider buffers when setting stops around volatile crypto assets
- Monitor news events that could cause sudden price jumps
- Consider using trailing stops that adjust as prices move favorably
Additionally, be cautious about overtrading—placing too many tight-stop orders across multiple positions—which can lead not only into increased transaction costs but also emotional fatigue.
Practical Examples of Setting Stop-Losses Around Chart Patterns
Understanding theoretical concepts becomes clearer through real-world examples:
Bitcoin Head & Shoulders Pattern
In January 2021, Bitcoin formed a head-and-shoulders top on its daily chart—a classic reversal signal indicating possible downside movement toward $30,000 area after confirming breakdown below neckline at approximately $35,000–$36,000 . Traders who anticipated this setup placed their stop-loss just above recent swing highs near $37,500 . When Bitcoin broke beneath $35k , those who had positioned their stops accordingly limited losses effectively .
Ethereum Symmetrical Triangle
In March 2023 , Ethereum displayed a symmetrical triangle formation on weekly charts . Traders expecting an upward breakout placed their protective orders slightly above resistance at around $1 ,500 . Once Ethereum surged past this level , triggered buy signals followed by trailing stops helped lock profits while managing downside risks .
These case studies highlight how aligning technical insights with strategic placement enhances overall trade management.
Best Practices for Effective Stop-Loss Placement
To optimize your use of stop-loss orders around chart patterns:
- Always analyze multiple timeframes before entering trades — longer-term charts provide context while shorter-term charts refine entries
- Avoid setting overly tight stops which might be triggered by normal market noise
- Use recent swing lows/highs as logical reference points
- Adjust your position size according to your risk tolerance — risking no more than 1–2% per trade is advisable
- Regularly review open positions — markets evolve rapidly; adapt your exit strategies accordingly
By integrating disciplined planning with continuous learning about technical developments—including new indicator tools—you build resilience against unpredictable crypto market behavior.
In Summary
Setting effective stop-loss levels around chart patterns combines technical analysis expertise with sound risk management principles tailored specifically for highly volatile markets like cryptocurrencies. Recognizing key formations such as head-and shoulders or triangles enables traders not only better entry timing but also strategic exit planning through well-positioned protective orders—all aimed at safeguarding capital while maximizing profit opportunities within defined risk parameters.
JCUSER-WVMdslBw
2025-05-09 06:17
How do you set stop-loss levels around chart patterns?
How to Set Stop-Loss Levels Around Chart Patterns in Trading
Effective risk management is essential for successful trading, especially in volatile markets like cryptocurrencies. One of the most important tools traders use to limit potential losses is the stop-loss order. When combined with technical analysis—particularly chart patterns—setting appropriate stop-loss levels can significantly improve trading outcomes. This guide provides a comprehensive overview of how to set stop-loss levels around chart patterns, ensuring you make informed decisions that balance risk and reward.
Understanding Stop-Loss Orders and Their Role in Trading
A stop-loss order is an automatic instruction to sell a security once its price reaches a predetermined level. Its primary purpose is to protect traders from significant losses if the market moves against their position. In practice, setting a well-placed stop-loss helps prevent emotional decision-making during volatile market swings and ensures disciplined trading.
In the context of chart patterns, stop-loss levels are strategically placed based on expected price movements associated with specific formations. Proper placement requires understanding both the pattern's characteristics and current market conditions.
Common Chart Patterns Used for Trade Entries
Chart patterns visually represent historical price movements and help predict future trends when interpreted correctly. Recognizing these formations allows traders to identify potential entry points and determine where to place their stops.
Head and Shoulders
This pattern signals a potential trend reversal from bullish to bearish or vice versa. It features three peaks: a higher middle peak (head) flanked by two lower peaks (shoulders). The neckline connects the lows between these peaks; breaking below this line often indicates further downside movement.
Triangles
Triangles are consolidation patterns formed by converging trendlines connecting higher lows and lower highs:
- Symmetrical Triangle: Indicates indecision; breakout direction suggests future trend.
- Ascending Triangle: Bullish continuation pattern.
- Descending Triangle: Bearish continuation pattern.
Wedges
Wedges resemble triangles but have sloped boundaries indicating strong trending behavior before reversal or continuation:
- Rising Wedge: Usually bearish.
- Falling Wedge: Often bullish.
Reversal Patterns: Double Tops & Bottoms
Double tops suggest an impending downtrend after two failed attempts at breaking resistance, while double bottoms indicate potential upward reversals after testing support twice.
Strategies for Setting Stop-Loss Levels Based on Chart Patterns
Choosing where to place your stop-loss depends on your analysis of each pattern’s structure, volatility considerations, and your risk appetite. There are generally two approaches:
Conservative Approach
This method involves placing stops close enough that minor fluctuations won't trigger them unnecessarily but still provide protection against significant adverse moves:
- For head-and-shoulders: Just below the neckline in a bearish setup.
- For bullish reversal patterns: Slightly below key support levels or recent swing lows.
This approach minimizes losses but may result in more frequent triggers due to normal market noise.
Aggressive Approach
Here, stops are set further away from entry points—just above resistance levels in bearish setups or just below support lines in bullish scenarios—to avoid premature exits caused by minor retracements:
- For bearish breakouts: Slightly above resistance zones.
- For bullish breakouts: Slightly below support zones.
While this reduces false triggers, it exposes traders to larger potential losses if the trade goes wrong quickly.
Incorporating Technical Indicators for Better Stop Placement
Using additional technical tools can enhance your ability to set effective stop-loss levels around chart patterns:
- Moving Averages – Placing stops just beyond key moving average lines (e.g., 50-day MA) can provide dynamic support/resistance references.
- Relative Strength Index (RSI) – Overbought or oversold conditions may influence where you place stops relative to overextension zones.
- Bollinger Bands – These volatility bands help identify extreme price deviations; placing stops outside these bands can prevent being stopped out prematurely during normal fluctuations.
Combining these indicators with chart pattern analysis offers more robust risk management strategies aligned with current market dynamics.
Managing Risks Specific To Cryptocurrency Markets
Cryptocurrency markets are known for their high volatility compared to traditional assets like stocks or forex pairs. This characteristic makes precise stop-loss placement even more critical because sudden gaps or sharp moves can trigger orders unexpectedly—a phenomenon known as "market gaps."
To mitigate such risks:
- Use wider buffers when setting stops around volatile crypto assets
- Monitor news events that could cause sudden price jumps
- Consider using trailing stops that adjust as prices move favorably
Additionally, be cautious about overtrading—placing too many tight-stop orders across multiple positions—which can lead not only into increased transaction costs but also emotional fatigue.
Practical Examples of Setting Stop-Losses Around Chart Patterns
Understanding theoretical concepts becomes clearer through real-world examples:
Bitcoin Head & Shoulders Pattern
In January 2021, Bitcoin formed a head-and-shoulders top on its daily chart—a classic reversal signal indicating possible downside movement toward $30,000 area after confirming breakdown below neckline at approximately $35,000–$36,000 . Traders who anticipated this setup placed their stop-loss just above recent swing highs near $37,500 . When Bitcoin broke beneath $35k , those who had positioned their stops accordingly limited losses effectively .
Ethereum Symmetrical Triangle
In March 2023 , Ethereum displayed a symmetrical triangle formation on weekly charts . Traders expecting an upward breakout placed their protective orders slightly above resistance at around $1 ,500 . Once Ethereum surged past this level , triggered buy signals followed by trailing stops helped lock profits while managing downside risks .
These case studies highlight how aligning technical insights with strategic placement enhances overall trade management.
Best Practices for Effective Stop-Loss Placement
To optimize your use of stop-loss orders around chart patterns:
- Always analyze multiple timeframes before entering trades — longer-term charts provide context while shorter-term charts refine entries
- Avoid setting overly tight stops which might be triggered by normal market noise
- Use recent swing lows/highs as logical reference points
- Adjust your position size according to your risk tolerance — risking no more than 1–2% per trade is advisable
- Regularly review open positions — markets evolve rapidly; adapt your exit strategies accordingly
By integrating disciplined planning with continuous learning about technical developments—including new indicator tools—you build resilience against unpredictable crypto market behavior.
In Summary
Setting effective stop-loss levels around chart patterns combines technical analysis expertise with sound risk management principles tailored specifically for highly volatile markets like cryptocurrencies. Recognizing key formations such as head-and shoulders or triangles enables traders not only better entry timing but also strategic exit planning through well-positioned protective orders—all aimed at safeguarding capital while maximizing profit opportunities within defined risk parameters.
Disclaimer:Contains third-party content. Not financial advice.
See Terms and Conditions.
Understanding Gas Fee Dynamics on Ethereum After EIP-1559
Ethereum's network has long been a popular platform for decentralized applications, smart contracts, and digital assets. However, high and unpredictable gas fees have often hindered user experience and transaction efficiency. The introduction of EIP-1559 in August 2021 marked a pivotal shift in how transaction fees are calculated and prioritized on the Ethereum blockchain. To fully grasp how these changes influence transaction priority today, it’s essential to understand the mechanics behind gas fee dynamics post-EIP-1559.
What Are Gas Fees and Why Do They Matter?
Gas fees are the costs paid by users to process transactions or execute smart contracts on Ethereum. These fees compensate miners (or validators in proof-of-stake systems) for including transactions in blocks. Prior to EIP-1559, gas prices were determined through a first-price auction system where users bid against each other; higher bids meant faster processing but also led to volatile costs that could spike unpredictably during periods of network congestion.
High gas fees not only made small transactions less feasible but also created barriers for developers and users seeking cost-effective interactions with decentralized applications (dApps). This environment underscored the need for a more predictable fee structure—one that balances fairness with efficiency.
How EIP-1559 Changed Gas Fee Mechanics
EIP-1559 introduced several fundamental modifications aimed at stabilizing gas prices while improving transaction prioritization:
Base Fee and Priority Fee: The New Dual Components
The core innovation was splitting total transaction fees into two parts:
Base Fee: A mandatory fee paid to miners (or validators), dynamically adjusted based on network congestion.
Priority Fee (Tip): An optional incentive set by users to prioritize their transactions over others.
This separation allows the network to better manage fee volatility by setting a minimum base cost while giving users control over how quickly their transactions are processed through additional tips.
Dynamic Adjustment of Base Fees
Unlike previous fixed or auction-based models, the base fee is recalculated every 12 blocks depending on recent block utilization:
If blocks are consistently full, the base fee increases.
If there’s slack capacity, it decreases.
This mechanism helps maintain an optimal balance between throughput and cost stability by preventing sudden spikes or drops in gas prices.
Transaction Prioritization Based on User Set Tips
Prioritization now depends primarily on how much extra tip (priority fee) a user attaches rather than bidding against others’ bids. Transactions with higher tips get processed sooner because miners see them as more financially attractive—this encourages fairer competition based on willingness-to-pay rather than bidding wars that could inflate costs unnecessarily.
Impact of EIP-1559 on Transaction Priority
The new system significantly influences how quickly transactions are confirmed:
Increased Predictability & Stability
By fixing the minimum base fee per block interval, users can better anticipate their costs without worrying about sudden surges caused by competitive bidding wars. This predictability enhances planning capabilities for both individual users and businesses relying heavily on timely confirmations.
Fairness Through Tip-Based Prioritization
Rather than engaging in costly bidding wars during peak times—which often favored wealthier participants—the new model allows anyone willing to pay an appropriate tip to have their transaction prioritized efficiently. This approach promotes fairness across different user segments while maintaining overall network throughput.
Enhanced User Control & Experience
Users can now decide how urgent their transactions are by adjusting their priority tip accordingly. For example:
A user sending funds urgently might set a higher tip, whereas a routine transfer might opt for minimal additional payment. This flexibility improves transparency around costs compared with earlier models where bidders had little control over final outcomes beyond bid amounts alone.
Recent Developments Improving Gas Price Management
Since its deployment, ongoing refinements aim at optimizing this new dynamic:
Frequent Base Fee Adjustments: Every 12 blocks ensures real-time responsiveness aligned with current demand levels.
User Experimentation: Users have tested various priority tips under different conditions—helping developers understand optimal strategies for balancing cost versus speed.
Community Feedback Integration: Continuous feedback from stakeholders has led developers toward further improvements such as better algorithms for adjusting base fees or educating users about effective tip-setting practices.
Challenges & Limitations of Post-EIP-1559 Gas Dynamics
While EIP-1559 brought notable benefits, some issues remain:
Initial Adjustment Periods & Volatility
During early implementation phases, both miners/validators and users experienced transitional volatility as they adapted strategies within this new framework—a period marked by fluctuating gas prices until equilibrium was reached.
Scalability Concerns Persist
EIP-1559 does not directly address underlying scalability issues like limited block space or throughput constraints; thus high demand still results in elevated fees despite improved mechanisms—highlighting ongoing needs for layer 2 solutions such as rollups or sharding technologies.
Need For Better User Education
Effective use of priority tips requires understanding current network conditions; without proper guidance or tools—like real-time analytics—users may either overpay unnecessarily or face delays due to insufficient tipping strategies.
How Gas Price Dynamics Influence Transaction Efficiency Today
Post-EIP-1559 dynamics mean that:
- Users who set appropriate priority tips can expect faster confirmation times during congested periods.
- Network stability reduces unexpected spikes but still requires active management from end-users.
- Developers benefit from more predictable operational costs when designing dApps requiring frequent interactions.
Moreover, understanding these mechanics enables traders and businesses operating within DeFi ecosystems—or those conducting large-scale transfers—to optimize timing based on anticipated congestion patterns.
Future Outlook: Enhancing Ethereum’s Transaction Ecosystem
Looking ahead:
- Further protocol upgrades may improve scalability alongside existing fee mechanisms.
- Community-driven innovations aim at creating smarter tools that help estimate ideal tips based on real-time data.
- Educational initiatives will be vital so all participants—from casual traders to institutional actors—can navigate complex fee structures confidently.
By continuously refining these systems through community feedback—and integrating advanced Layer 2 solutions—the Ethereum ecosystem aims at delivering lower-cost transactions with reliable prioritization methods suited both casual use cases and enterprise-level demands.
Understanding how post-EIP-1558 gas price dynamics shape transaction priorities is crucial whether you're an everyday user aiming for affordable transfers or a developer optimizing dApp performance amid fluctuating demand levels. As Ethereum evolves—with ongoing improvements driven by community input—the goal remains clear: create an efficient, fairer system where transaction speed aligns transparently with user willingness-to-pay within sustainable economic parameters.
JCUSER-IC8sJL1q
2025-05-14 19:34
How do gas fee dynamics post-EIP-1559 influence transaction priority on Ethereum (ETH)?
Understanding Gas Fee Dynamics on Ethereum After EIP-1559
Ethereum's network has long been a popular platform for decentralized applications, smart contracts, and digital assets. However, high and unpredictable gas fees have often hindered user experience and transaction efficiency. The introduction of EIP-1559 in August 2021 marked a pivotal shift in how transaction fees are calculated and prioritized on the Ethereum blockchain. To fully grasp how these changes influence transaction priority today, it’s essential to understand the mechanics behind gas fee dynamics post-EIP-1559.
What Are Gas Fees and Why Do They Matter?
Gas fees are the costs paid by users to process transactions or execute smart contracts on Ethereum. These fees compensate miners (or validators in proof-of-stake systems) for including transactions in blocks. Prior to EIP-1559, gas prices were determined through a first-price auction system where users bid against each other; higher bids meant faster processing but also led to volatile costs that could spike unpredictably during periods of network congestion.
High gas fees not only made small transactions less feasible but also created barriers for developers and users seeking cost-effective interactions with decentralized applications (dApps). This environment underscored the need for a more predictable fee structure—one that balances fairness with efficiency.
How EIP-1559 Changed Gas Fee Mechanics
EIP-1559 introduced several fundamental modifications aimed at stabilizing gas prices while improving transaction prioritization:
Base Fee and Priority Fee: The New Dual Components
The core innovation was splitting total transaction fees into two parts:
Base Fee: A mandatory fee paid to miners (or validators), dynamically adjusted based on network congestion.
Priority Fee (Tip): An optional incentive set by users to prioritize their transactions over others.
This separation allows the network to better manage fee volatility by setting a minimum base cost while giving users control over how quickly their transactions are processed through additional tips.
Dynamic Adjustment of Base Fees
Unlike previous fixed or auction-based models, the base fee is recalculated every 12 blocks depending on recent block utilization:
If blocks are consistently full, the base fee increases.
If there’s slack capacity, it decreases.
This mechanism helps maintain an optimal balance between throughput and cost stability by preventing sudden spikes or drops in gas prices.
Transaction Prioritization Based on User Set Tips
Prioritization now depends primarily on how much extra tip (priority fee) a user attaches rather than bidding against others’ bids. Transactions with higher tips get processed sooner because miners see them as more financially attractive—this encourages fairer competition based on willingness-to-pay rather than bidding wars that could inflate costs unnecessarily.
Impact of EIP-1559 on Transaction Priority
The new system significantly influences how quickly transactions are confirmed:
Increased Predictability & Stability
By fixing the minimum base fee per block interval, users can better anticipate their costs without worrying about sudden surges caused by competitive bidding wars. This predictability enhances planning capabilities for both individual users and businesses relying heavily on timely confirmations.
Fairness Through Tip-Based Prioritization
Rather than engaging in costly bidding wars during peak times—which often favored wealthier participants—the new model allows anyone willing to pay an appropriate tip to have their transaction prioritized efficiently. This approach promotes fairness across different user segments while maintaining overall network throughput.
Enhanced User Control & Experience
Users can now decide how urgent their transactions are by adjusting their priority tip accordingly. For example:
A user sending funds urgently might set a higher tip, whereas a routine transfer might opt for minimal additional payment. This flexibility improves transparency around costs compared with earlier models where bidders had little control over final outcomes beyond bid amounts alone.
Recent Developments Improving Gas Price Management
Since its deployment, ongoing refinements aim at optimizing this new dynamic:
Frequent Base Fee Adjustments: Every 12 blocks ensures real-time responsiveness aligned with current demand levels.
User Experimentation: Users have tested various priority tips under different conditions—helping developers understand optimal strategies for balancing cost versus speed.
Community Feedback Integration: Continuous feedback from stakeholders has led developers toward further improvements such as better algorithms for adjusting base fees or educating users about effective tip-setting practices.
Challenges & Limitations of Post-EIP-1559 Gas Dynamics
While EIP-1559 brought notable benefits, some issues remain:
Initial Adjustment Periods & Volatility
During early implementation phases, both miners/validators and users experienced transitional volatility as they adapted strategies within this new framework—a period marked by fluctuating gas prices until equilibrium was reached.
Scalability Concerns Persist
EIP-1559 does not directly address underlying scalability issues like limited block space or throughput constraints; thus high demand still results in elevated fees despite improved mechanisms—highlighting ongoing needs for layer 2 solutions such as rollups or sharding technologies.
Need For Better User Education
Effective use of priority tips requires understanding current network conditions; without proper guidance or tools—like real-time analytics—users may either overpay unnecessarily or face delays due to insufficient tipping strategies.
How Gas Price Dynamics Influence Transaction Efficiency Today
Post-EIP-1559 dynamics mean that:
- Users who set appropriate priority tips can expect faster confirmation times during congested periods.
- Network stability reduces unexpected spikes but still requires active management from end-users.
- Developers benefit from more predictable operational costs when designing dApps requiring frequent interactions.
Moreover, understanding these mechanics enables traders and businesses operating within DeFi ecosystems—or those conducting large-scale transfers—to optimize timing based on anticipated congestion patterns.
Future Outlook: Enhancing Ethereum’s Transaction Ecosystem
Looking ahead:
- Further protocol upgrades may improve scalability alongside existing fee mechanisms.
- Community-driven innovations aim at creating smarter tools that help estimate ideal tips based on real-time data.
- Educational initiatives will be vital so all participants—from casual traders to institutional actors—can navigate complex fee structures confidently.
By continuously refining these systems through community feedback—and integrating advanced Layer 2 solutions—the Ethereum ecosystem aims at delivering lower-cost transactions with reliable prioritization methods suited both casual use cases and enterprise-level demands.
Understanding how post-EIP-1558 gas price dynamics shape transaction priorities is crucial whether you're an everyday user aiming for affordable transfers or a developer optimizing dApp performance amid fluctuating demand levels. As Ethereum evolves—with ongoing improvements driven by community input—the goal remains clear: create an efficient, fairer system where transaction speed aligns transparently with user willingness-to-pay within sustainable economic parameters.
Disclaimer:Contains third-party content. Not financial advice.
See Terms and Conditions.
How Chikou Span Confirmation Helps Reduce False Signals in Technical Analysis
Understanding how to accurately interpret market signals is essential for traders aiming to make informed decisions. Among various technical indicators, the Chikou Span—an integral part of the Ichimoku Cloud system—stands out for its ability to confirm trends and reduce false signals. This article explores how Chikou Span confirmation enhances trading accuracy, especially in volatile markets like cryptocurrencies.
What Is the Chikou Span and Its Role in Technical Analysis?
The Chikou Span, often called the Lagging Span, is a component of the Ichimoku Cloud indicator suite. It plots the closing price of an asset 26 periods behind its current position on a chart. This lagging aspect helps smooth out short-term price fluctuations, providing traders with a clearer view of overall market momentum.
In practical terms, when analyzing charts, traders observe where the Chikou Span lies relative to past prices and other Ichimoku components. Its position offers insights into whether a trend is strengthening or weakening. For example, if it crosses above past prices or other key levels, it can signal bullish momentum; if it crosses below, bearish conditions may be emerging.
How Does The Chikou Span Confirm Market Trends?
The primary function of the Chikou Span is trend confirmation rather than prediction. When used correctly alongside other elements like Tenkan-Sen (Conversion Line) and Kijun-Sen (Base Line), it provides validation for potential entry or exit points.
For instance:
- Bullish Confirmation: When the current price is above cloud levels and the Chikou Span crosses above past prices around 26 periods ago.
- Bearish Confirmation: Conversely, when prices are below cloud support levels with the Chikoh Span crossing below previous lows.
This cross-verification reduces reliance on single indicators that might generate misleading signals due to short-term volatility or market noise.
Reducing False Signals Through Trend Validation
False signals occur when traders act on misleading cues from technical tools—often caused by sudden spikes or dips that don't reflect true market direction. The strength of using Chiok Spans lies in their ability to filter these noise-induced errors by confirming whether recent price movements align with established trends.
Here’s how this works:
- Smoothing Effect: Since it plots data 26 periods behind, abrupt short-term swings are less likely to trigger false alarms.
- Trend Alignment: A genuine trend will typically show consistent alignment between current prices and where the Chikou Span sits relative to historical data.
- Confirmation Overlap: Combining this with other Ichimoku components ensures that multiple signals agree before executing trades—a practice known as confluence—which significantly minimizes false positives.
By requiring multiple confirmations—such as price position relative to cloud boundaries along with favorable Chiok Spans—the likelihood of acting on deceptive moves diminishes considerably.
Enhancing Trading Strategies With Multiple Indicators
While relying solely on one indicator can be risky—even effective ones like Chiok Spans—they work best within a broader analytical framework. Traders often combine them with additional tools such as moving averages or RSI (Relative Strength Index) for more robust decision-making processes.
For example:
- Using RSI alongside Ichimoku components helps identify overbought or oversold conditions.
- Moving averages can provide dynamic support/resistance levels aligned with trend directions confirmed by Chiok Spans.
This layered approach ensures that each trade decision rests upon multiple layers of evidence rather than isolated signals prone to false alarms—a crucial principle especially relevant in highly volatile markets like cryptocurrencies where rapid shifts are common.
Recent Trends: Cryptocurrency Markets & Advanced Usage
In recent years, cryptocurrency trading has seen increased adoption of advanced technical analysis techniques—including Ichimoku Cloud strategies involving Chiok Spans—to navigate extreme volatility effectively. Traders have reported that incorporating these confirmations reduces whipsaws—erratic reversals caused by fleeting market noise—and improves overall trade accuracy.
Moreover:
- Many crypto traders now integrate Chiok Spans into algorithmic trading systems for real-time validation.
- Online communities actively discuss best practices around combining Ichimoku components with other indicators for optimal results.
However, it's important to recognize limitations: despite its strengths in filtering false signals during trending phases, Chiok Spans may lag during sudden reversals or choppy markets where quick reactions are necessary but delayed confirmation could hinder timely entries/exits.
Potential Limitations And Best Practices
While powerful as part of an integrated strategy, relying exclusively on Chilkou spans carries risks:
- Lagging Nature: As a lagging indicator based on historical data points (26 periods back), it might delay recognition of new trends or reversals.
- Market Conditions Sensitivity: In sideways markets characterized by consolidation phases without clear directional movement—the effectiveness diminishes because both bullish and bearish confirmations become ambiguous.
- Overdependence Risks: Excessive reliance may lead traders into overtrading based solely on confirmed signals without considering fundamental factors or broader context.
To maximize benefits while mitigating drawbacks:
- Use Chilkou spans alongside leading indicators such as candlestick patterns or volume analysis.
- Confirm trends across multiple timeframes before executing trades.
- Remain adaptable; adjust parameters if market conditions shift from trending behavior toward sideways movement.
Improving Trading Accuracy With Effective Use Of Chilkou Spans
Incorporating Chilkou span confirmation into your trading approach enhances reliability by filtering out many common pitfalls associated with false alerts inherent in technical analysis tools alone. By understanding its role within comprehensive strategies—including confluence checks across various indicators—you gain better control over entry/exit timing amid unpredictable markets like cryptocurrencies.
Key Takeaways:
- The Chilkou span acts as a trend confirmer within Ichimoku Cloud analysis
- It helps smooth out short-term volatility effects
- Combining Chilkou span insights with other tools reduces chances of acting on false signals
- Awareness about its lagging nature ensures balanced expectations
- Adaptation according to specific market environments maximizes effectiveness
Implementing these principles allows traders not only improve their confidence but also develop more disciplined approaches grounded in validated technical evidence rather than impulsive reactions driven by fleeting moves—all vital skills for success across diverse financial landscapes today
JCUSER-F1IIaxXA
2025-05-09 08:36
How can Chikou Span confirmation reduce false signals?
How Chikou Span Confirmation Helps Reduce False Signals in Technical Analysis
Understanding how to accurately interpret market signals is essential for traders aiming to make informed decisions. Among various technical indicators, the Chikou Span—an integral part of the Ichimoku Cloud system—stands out for its ability to confirm trends and reduce false signals. This article explores how Chikou Span confirmation enhances trading accuracy, especially in volatile markets like cryptocurrencies.
What Is the Chikou Span and Its Role in Technical Analysis?
The Chikou Span, often called the Lagging Span, is a component of the Ichimoku Cloud indicator suite. It plots the closing price of an asset 26 periods behind its current position on a chart. This lagging aspect helps smooth out short-term price fluctuations, providing traders with a clearer view of overall market momentum.
In practical terms, when analyzing charts, traders observe where the Chikou Span lies relative to past prices and other Ichimoku components. Its position offers insights into whether a trend is strengthening or weakening. For example, if it crosses above past prices or other key levels, it can signal bullish momentum; if it crosses below, bearish conditions may be emerging.
How Does The Chikou Span Confirm Market Trends?
The primary function of the Chikou Span is trend confirmation rather than prediction. When used correctly alongside other elements like Tenkan-Sen (Conversion Line) and Kijun-Sen (Base Line), it provides validation for potential entry or exit points.
For instance:
- Bullish Confirmation: When the current price is above cloud levels and the Chikou Span crosses above past prices around 26 periods ago.
- Bearish Confirmation: Conversely, when prices are below cloud support levels with the Chikoh Span crossing below previous lows.
This cross-verification reduces reliance on single indicators that might generate misleading signals due to short-term volatility or market noise.
Reducing False Signals Through Trend Validation
False signals occur when traders act on misleading cues from technical tools—often caused by sudden spikes or dips that don't reflect true market direction. The strength of using Chiok Spans lies in their ability to filter these noise-induced errors by confirming whether recent price movements align with established trends.
Here’s how this works:
- Smoothing Effect: Since it plots data 26 periods behind, abrupt short-term swings are less likely to trigger false alarms.
- Trend Alignment: A genuine trend will typically show consistent alignment between current prices and where the Chikou Span sits relative to historical data.
- Confirmation Overlap: Combining this with other Ichimoku components ensures that multiple signals agree before executing trades—a practice known as confluence—which significantly minimizes false positives.
By requiring multiple confirmations—such as price position relative to cloud boundaries along with favorable Chiok Spans—the likelihood of acting on deceptive moves diminishes considerably.
Enhancing Trading Strategies With Multiple Indicators
While relying solely on one indicator can be risky—even effective ones like Chiok Spans—they work best within a broader analytical framework. Traders often combine them with additional tools such as moving averages or RSI (Relative Strength Index) for more robust decision-making processes.
For example:
- Using RSI alongside Ichimoku components helps identify overbought or oversold conditions.
- Moving averages can provide dynamic support/resistance levels aligned with trend directions confirmed by Chiok Spans.
This layered approach ensures that each trade decision rests upon multiple layers of evidence rather than isolated signals prone to false alarms—a crucial principle especially relevant in highly volatile markets like cryptocurrencies where rapid shifts are common.
Recent Trends: Cryptocurrency Markets & Advanced Usage
In recent years, cryptocurrency trading has seen increased adoption of advanced technical analysis techniques—including Ichimoku Cloud strategies involving Chiok Spans—to navigate extreme volatility effectively. Traders have reported that incorporating these confirmations reduces whipsaws—erratic reversals caused by fleeting market noise—and improves overall trade accuracy.
Moreover:
- Many crypto traders now integrate Chiok Spans into algorithmic trading systems for real-time validation.
- Online communities actively discuss best practices around combining Ichimoku components with other indicators for optimal results.
However, it's important to recognize limitations: despite its strengths in filtering false signals during trending phases, Chiok Spans may lag during sudden reversals or choppy markets where quick reactions are necessary but delayed confirmation could hinder timely entries/exits.
Potential Limitations And Best Practices
While powerful as part of an integrated strategy, relying exclusively on Chilkou spans carries risks:
- Lagging Nature: As a lagging indicator based on historical data points (26 periods back), it might delay recognition of new trends or reversals.
- Market Conditions Sensitivity: In sideways markets characterized by consolidation phases without clear directional movement—the effectiveness diminishes because both bullish and bearish confirmations become ambiguous.
- Overdependence Risks: Excessive reliance may lead traders into overtrading based solely on confirmed signals without considering fundamental factors or broader context.
To maximize benefits while mitigating drawbacks:
- Use Chilkou spans alongside leading indicators such as candlestick patterns or volume analysis.
- Confirm trends across multiple timeframes before executing trades.
- Remain adaptable; adjust parameters if market conditions shift from trending behavior toward sideways movement.
Improving Trading Accuracy With Effective Use Of Chilkou Spans
Incorporating Chilkou span confirmation into your trading approach enhances reliability by filtering out many common pitfalls associated with false alerts inherent in technical analysis tools alone. By understanding its role within comprehensive strategies—including confluence checks across various indicators—you gain better control over entry/exit timing amid unpredictable markets like cryptocurrencies.
Key Takeaways:
- The Chilkou span acts as a trend confirmer within Ichimoku Cloud analysis
- It helps smooth out short-term volatility effects
- Combining Chilkou span insights with other tools reduces chances of acting on false signals
- Awareness about its lagging nature ensures balanced expectations
- Adaptation according to specific market environments maximizes effectiveness
Implementing these principles allows traders not only improve their confidence but also develop more disciplined approaches grounded in validated technical evidence rather than impulsive reactions driven by fleeting moves—all vital skills for success across diverse financial landscapes today
Disclaimer:Contains third-party content. Not financial advice.
See Terms and Conditions.